


Most developed markets today are hamstrung by weak demographics. Slowing labor force growth impinges on economic growth and the aging baby boom generation will put a growing burden on government budgets given entitlement obligations. Equity valuations are high in the U.S., as are margins and earnings growth expectations. We believe that U.S. investors can benefit by adopting an active management point of view when it comes to how they construct their portfolios and in the case of Emerging Markets, diversifying in those markets where the demographic backdrop is accommodative to growth, valuations are reasonable (if not cheap) and relative earnings growth looks attractive. To reduce the potential volatility that accompanies Emerging Markets we suggest that investors avoid the more cyclical commodity industries and Financials sectors and focus on those sectors and companies that we believe will benefit from the burgeoning global middle class.
A Longer Term Perspective on the Emerging Markets Landscape
Over the last two decades, the emerging markets story has been primarily wrapped around China and its unprecedented growth. China built a strong export-oriented manufacturing base and relocated some 400 million rural Chinese farm laborers into cities. In 1990, China’s urban population represented just 25 percent of the total population; today it represents about 55 percent. Epitomizing the rapid growth seen in China, in just a three-year span more cement was poured in China (between 2011 and 2013) than was poured in the U.S. during the entire 20th century. The size, rapidity, and magnitude of China’s industrialization and urbanization cannot be overstated. This massive building boom in China became the emerging market story. Across the world, resource capacity was built and funded by the financial sector to serve this seemingly insatiable appetite for building materials. But now China has shifted its focus and embarked on a slow transition to a more inwardly focused economy that emphasizes service and consumption rather than industry and construction. This transition threw the Emerging Markets into disarray, leaving many countries and companies with too much debt and resource capacity to serve China’s old growth model. Commodity prices peaked in 2011 and continued to fall through the end of 2015 taking Emerging Market equity prices down with them.
The Middle Class1: Size and Distribution
(millions of people, global share2)
| 2009 | % | Project 2020 | % | Project 2030 | % | |
|---|---|---|---|---|---|---|
| North America | 338 | 18% | 333 | 10% | 322 | 7% |
| Europe | 664 | 36% | 703 | 22% | 680 | 14% |
| Central and South America | 181 | 10% | 251 | 8% | 313 | 6% |
| Asia-Pacific | 525 | 28% | 1,740 | 54% | 3228 | 66% |
| Sub-Saharan Africa | 32 | 2% | 57 | 2% | 107 | 5% |
| Middle East and North Africa | 105 | 6% | 165 | 5% | 234 | 5% |
| World | 1,845 | 100% | 3,246 | 100% | 4,884 | 100% |
Source: OECD: Kharas and Gertz, 2010
Now let's look at the other side. China has made tremendous progress in its economic transition. Exports now represent less than 20 percent of China’s gross domestic product (GDP), compared to 37 percent in 2006. More importantly, the key to the Emerging Markets story going forward is that China is no longer a low-cost producer. Manufacturing wages in China are higher than all Latin American countries with the exception of Chile and higher than all of the Emerging Market countries in Asia. Higher wages mean more disposable income for the Chinese, but it is also benefiting other Emerging Markets. Labor intensive manufacturing is moving out of China and into other Emerging Markets. China’s success is now flowing outward to other Emerging Markets, bringing jobs and moving a new population into the middle class. Emerging Market countries already represent a large portion of the world’s labor force and are projected to become even larger. Emerging Markets represent 90 percent of the global population aged under 30. With jobs comes income and this income is moving millions of people out of poverty. The Brookings Institution estimates that 150 million people are now moving into the middle class every year, and that number is growing.
Further, Brookings estimates that global middle-class spending will increase by over $20 trillion in the next decade through 2030, with approximately 80 percent of that coming from Asian Emerging Markets1.
1 Middle Class is defined at the threshold of those households that have disposable income
2 Global share is the percentage of people in the middle class by geographic region
Spending by the Global Middle Class
Purchasing Power Parity; constant 2011 billion ($) and shares (%)
| 2015 $ |
2015 % |
2020 $ |
2020 % |
2025 $ |
2025 % |
2030 $ |
2030 % |
|
|---|---|---|---|---|---|---|---|---|
| North America | 6,174 | 18 | 6,381 | 15 | 6,558 | 13 | 6,681 | 10 |
| Europe | 10,920 | 31 | 11,613 | 27 | 12,159 | 23 | 12,573 | 20 |
| Central and South America | 2,931 | 8 | 3,137 | 8 | 3,397 | 8 | 3,630 | 6 |
| Asia-Pacific | 12,332 | 36 | 18,174 | 43 | 26,519 | 51 | 36,631 | 57 |
| Sub-Saharan Africa | 915 | 3 | 1,042 | 2 | 1,295 | 2 | 1,661 | 3 |
| Middle East and North Africa | 1,541 | 4 | 1,933 | 5 | 2,306 | 4 | 2,679 | 4 |
| World | 34,814 | 100 | 42,279 | 100 | 52,234 | 100 | 63,854 | 100 |
It is important to note that this population and middle class Emerging Markets growth story is not uniform. Both South Korea and Russia have aging populations much like the developed world. There are also countries that have structural and regulatory hurdles that impede middle class growth (e.g. Turkey and Greece).
Why Invest in Actively Managed Emerging Markets Funds Now?
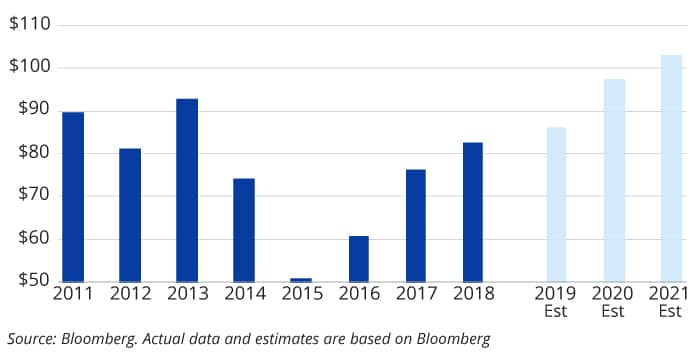
First, valuation looks attractive relative to the S&P 500 Index. On a simple price-to-earnings (P/E) basis the MSCI Emerging Markets Index traded at a 31 percent discount to the S&P 500 (at the end of December 2018) despite much higher earnings growth prospects. Second is the relative earnings growth prospects of Emerging Markets versus the S&P 500. With the S&P 500 near all-time high-profit margins and a tight labor market, we believe that earnings growth will be limited for the remainder of this cycle. On the other hand, we see better growth prospects for the MSCI Emerging Markets Index. Note the earnings chart below. Earnings are forecast to grow 24 percent over the next three years.
MSCI Emerging Markets Earnings Per Share
(2011 - 2021 Est)
How to Navigate Emerging Markets
We believe the MSCI Emerging Markets Index is a poor representation of the underlying middle-class consumer drivers discussed in this paper. The Index still has strong representation from the highly cyclical commodity and Financial Sectors (representing 40 percent of the EM Index), however, these sectors are less influenced by middle class growth. U.S. investors that adopt an active management point of view when it comes to how they construct their portfolios could benefit by considering sectors and industries that are more directly influenced by the burgeoning middle class which we believe will provide higher and more sustainable growth.
The S&P 500 Index is a group of 500 widely held stocks and is commonly regarded to be representative of the large capitalization stock universe.
The MSCI Emerging Markets Index is a free float-adjusted market capitalization index that is designed to measure equity market performance of emerging markets.
The indexes mentioned are unmanaged statistical composites of stock market or bond market performance. Investing in an index is not possible. Unmanaged index returns do not reflect any fees, expenses or sales charges.
Performance data quoted represents past performance, which is no guarantee of future results.
Investing in Equities, including International, Emerging and Frontier Market equities are subject to market volatility and loss. They also carry the associated risks of economic and political instability, market liquidity, currency volatility and differences in accounting standards. The risks associated with investing in international markets are magnified in emerging markets and frontier markets.
Please consider the investment objectives, risks, charges and expenses of the fund carefully before investing. The prospectus and the summary prospectus contain this and other information about the Fund. To obtain a prospectus or a summary prospectus, contact your financial professional or download and/or request one on the resources section or call Touchstone at 800-638-8194. Please read the prospectus and/or summary prospectus carefully before investing.
Touchstone Funds are distributed by Touchstone Securities, Inc.*
*A registered broker-dealer and member FINRA/SIPC.
Not FDIC Insured | No Bank Guarantee | May Lose Value

