


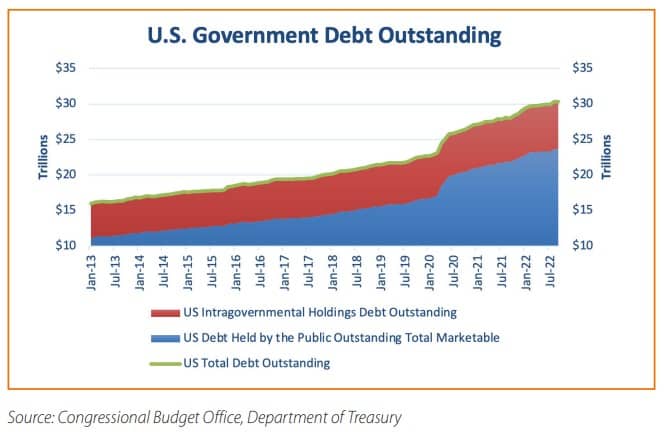
Over the course of the pandemic, total U.S. federal debt outstanding increased by $8.2 trillion, or 36%, to $30.9 trillion (September fiscal year 2019 to September 2022). Many are concerned about the absolute amount of debt held by the U.S. government as well as the increasing debt burden given higher interest rates.
How much debt do we have? It is not as simple a question as one might think - by one form of accounting it is $24.3 trillion, and by another it is $30.9 trillion (both as of September 2022). The $6.6 trillion difference between these two is made up of intragovernmental transfers (really IOUs). These IOUs represent the sum of the various trust funds set up for mandatory spending programs such as Social Security and Medicare.
To understand how these trust funds work and what this debt represents, imagine a hypothetical couple with the following pension plan. They put aside $100 from every paycheck to be deposited in a savings account. But before it goes into the savings account they spend it on groceries and write themselves an IOU for $100 and put it in a drawer.
Suppose that they have accumulated $5,000 in IOUs. Would you count that as debt? Personally, we would just file those IOUs under questionable practices; we would not call it debt. In order to make up a likely retirement funding shortage this couple may either have to work longer (increase the retirement age), spend less (reduce entitlement benefits), or get help from their children (raise taxes). Likely some combination of these.
Like this couple, our government follows a pay-as-you-go system as we have not funded our entitlement obligations. Nor is the amount held in these trust fund accounts indicative of our future entitlement burden. The trust funds are an accounting of the surplus of funds collected for entitlements less those distributed. Those funds were then spent on other parts of the budget creating those IOUs. We question how these funds can reliably speak to future obligations.
If we truly wanted to measure our mandatory spending obligations in the same fashion as does a corporation or a state pension, these trust funds would be a gross understatement. Actually the government has provided a present value estimate of their obligations over the next 75 years. The last time they did this was in 2016 and the liability was over $45 trillion. That would represent about $343,000 per household. We would treat this figure as a best case estimate, as like the Congressional Budget Office (CBO) budget forecast, the assumptions underlying this estimate are likely very conservatively derived. We’ve seen other estimates that are much higher, the US debt clock.org suggests it is over $125 trillion, while the Cato Institute believes our unfunded entitlement liabilities total $163 trillion with Social Security representing $60 trillion and Medicare $103 trillion.
So the true debt burden is not represented in the debt outstanding figures. It is unfortunate that this burden is hidden and is, we believe, one of the biggest hurdles for our government in the future. We think it would be better to address this now and spread the costs over a longer period of time. But that doesn’t appear to be the course we are taking. By kicking the can down the road we are likely increasing the amount of eventual pain we will have to endure.
Before we leave the trust fund debt, there are few important aspects about it that need to be pointed out.
- They are counted in the gross debt calculation for purposes of determining whether we are breaching the debt ceiling.
- When the trust funds are exhausted the current rules state that outlays have to be automatically cut to levels that are commensurate with the tax receipts tied to these programs. Concerning, but politically improbable.
- They only exist in ledger form, as such they do not impact the liquidity of Treasury’s outstanding or potentially crowd out other forms of borrowing.
- The government pays no interest on this debt, though they do add it to the IOU ledger.
- Lastly the debt is not represented in the Bloomberg U.S. Aggregate Bond Index, or any other fixed income index that we could find.
Removing those intragovernmental funds leaves us with the debt held by the public, also known as marketable securities, of $24.3 trillion. This is still a significant sum, representing over $185,000 per household. As a percentage of Gross Domestic Product (GDP) (through September 2022) it was 98%. According to the latest CBO estimates (February 2023), debt outstanding is expected to nearly double to $43.5 trillion in 2032, putting it at a projected 115% of GDP. In other words, the CBO expects debt growth to outpace GDP growth over the next 10 years.
Is that a lot? Certainly on a debt/GDP basis we are in the top ten of countries around the world. But it is not close to Japan’s ratio of debt to GDP at 234%. Ultimately an economy as strong as ours should be able to support a higher debt load, but the fact that we continue to build on it is concerning.
Another way to look at the debt burden is through the interest cost. Generally interest expense is measured relative to some measure of funding. Many look at interest cost versus GDP and by this measure is it quite low (1.6%) and will likely remain low, but we don’t see the relevance of this measure.
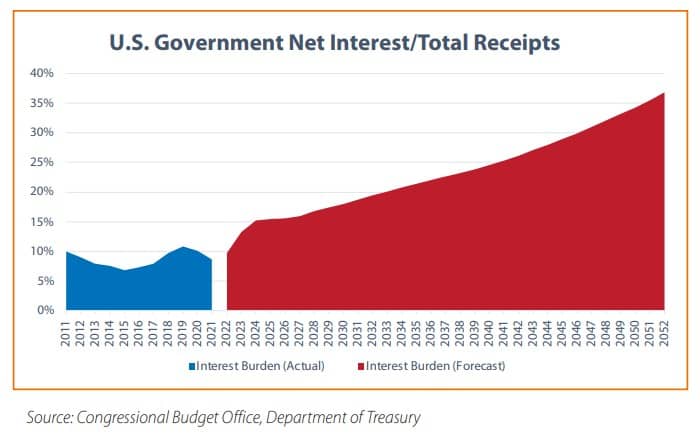
It is sort of like measuring a company’s interest expense as a percent of sales. We believe a more reasonable approach would be to look at interest expense as a percent of income – or in the case of government accounting, receipts. Net interest expense is currently running at about 9.7% of receipts, which is in line with the historical average going back to 1940. Looking back to 1940 we had a minimum of 5% and a maximum of 18% (in the early 1990s).
Looking forward, using CBO estimates, the interest burden will rise to 19.5% by 2032. The CBO’s projections for interest rates assumes that the 10 year Treasury yield averages 3.8% (close to current yields in February) and that short term rates average around 2.3%, which seems reasonable. To put it mildly 19.5% is a lot, and looking out further into the future it becomes overwhelming, expected to represent well over a third of our budget outlays.
Looking into the future, is there a near term risk with much higher interest rates and nearly 25% of Treasury debt maturing in 2023? Using Treasury data (fiscaldata.treasury.gov) we identified $5.7 trillion in Treasury bonds maturing in 2023 with a weighted average coupon of 2.4%. The CBO is projecting that the combination of higher interest costs and an increase of the deficit of 1.4 trillion will add ~$165 billion to the interest burden in fiscal year 2023. For perspective the 9.7% interest to receipts ratio would rise to 13%. This would be a meaningful increase, but likely manageable in the near term. Longer term this trend is not sustainable.
Conclusion
Over the last 3 years U.S. government debt has increased significantly as have interest rates. This combination is concerning, but our analysis suggest that the near term risks are limited. On the other hand, if we extend the time horizon and consider the off-balance sheet unfunded entitlement burden it becomes clear that something will have to change. One positive with respect to the entitlements is that there is still time to address the underfunded status. With a modest pull on all three levers (reduce benefits, extend age, and raise taxes) it would go a long way in helping reduce both expected entitlements as well as the deficit itself without creating too much economic harm. Unfortunately the time horizon for politicians is set by the election cycle, and these measures may turn voters off, as such it is possible that these budgetary issues are not addressed until it is nearly too late.
Glossary of Investment Terms and Index Definitions
The information provided reflects the research and opinion of Touchstone Investments as of the date indicated, and is subject to change without prior notice. Past performance is not indicative of future results. There is no assurance any of the trends mentioned will continue or forecasts will occur. Investing in certain sectors may involve additional risks and may not be appropriate for all investors.
The indexes mentioned are unmanaged statistical composites of stock or bond market performance. Investing in an index is not possible.
Please consider the investment objectives, risks, charges and expenses of the fund carefully before investing. The prospectus and the summary prospectus contain this and other information about the Fund. To obtain a prospectus or a summary prospectus, contact your financial professional or download and/or request one on the resources section or call Touchstone at 800-638-8194. Please read the prospectus and/or summary prospectus carefully before investing.
Investment return and principal value of an investment in a Fund will fluctuate so that an investor's shares, when redeemed, may be worth more or less than their original cost. All investing involves risk.
Touchstone Funds are distributed by Touchstone Securities, Inc.*
*A registered broker-dealer and member FINRA/SIPC.
Touchstone is a member of Western & Southern Financial Group
Not FDIC Insured | No Bank Guarantee | May Lose Value