Peak Oil - Then & Now
Peak oil theory assumes that peak production happens when depletion levels22 hit 50% of the expected ultimate recovery (EUR) of a resource. This is akin to Hubbert’s analysis and was generally the accepted view in the early 2000’s.
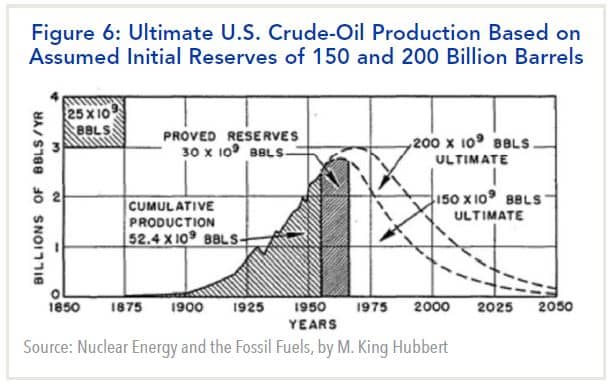
The last EUR estimate that we consider relatively clean was from the USGS back in 2000 (estimating 1996 data).
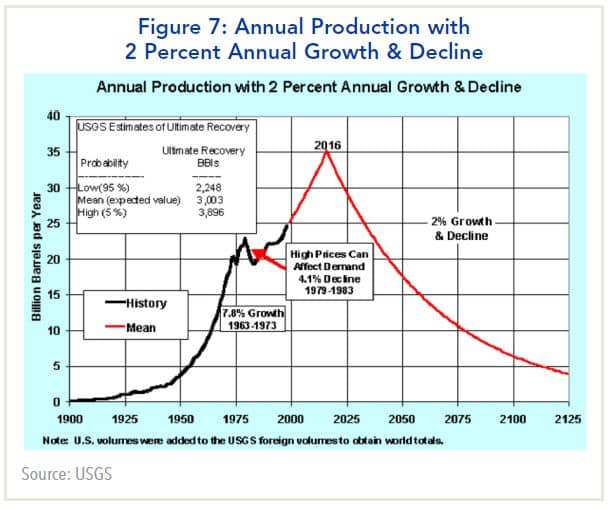
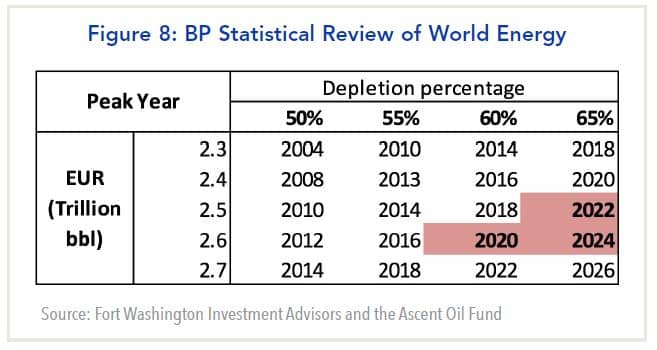
We adjust this data to take into account production levels since 1996. Tight oil estimates are largely baked into the EUR data. This produces an updated 2020 FWIA USGS adjusted EUR range of 1.7-3.3 trillion barrels with a 2.6 trillion barrel midpoint. Based on analysis since Hubbert’s work, a 60% depletion level23 is generally considered to be the tipping point at which cumulative depletion intersects with cumulative production. This is what we will call a modified PFC rule,24 where the original PFC rule focused on cumulative 2P discoveries. We are treating the EUR as 2P, which is very generous since the recovery of 2P reserves is much more likely than the 100% recovery of EUR. The 60% depletion level is thus 1.56 trillion barrels (60% of 2.6 trillion mid-point).
We have recreated a chart from the Ascent Oil Fund25 that was produced using data from the BP Statistical Review of World Energy. We adjusted it for production that we think was missed from the 1996-2000 USGS EUR data. Not surprisingly, our results are similar to that of the Ascent Oil Fund. Conventional production could roll at the end of 2019 or 2020 with an upper band of 2022-24. While the impacts from COVID-19 are material to current prices, they are immaterial to the resource base. Even if we assumed a 1:1 cut in production to supply (which is not happening) for 2 months at 35 mmbpd disruption, it would be 2.1 billion barrels or less than 0.15% of cumulative supply.
Back to the Future: Peak Oil Is Likely Here, Bottoms Up If You Don't Like Hubbert's Peak
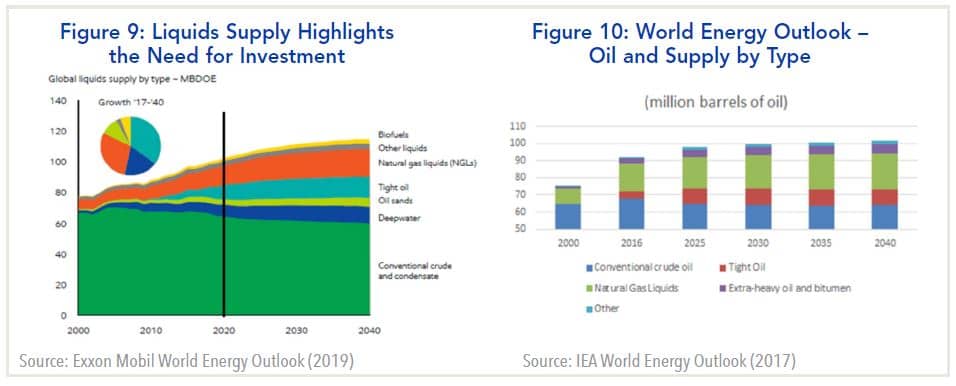 Consider an updated analysis by the IEA, shown in the figure below.28 The 2019 energy outlook appears to be rather optimistic (at the time) that they estimated 2019 tight oil production at just over 13 mmbpd, increasing to almost 20 mmbpd by 2030. This is shown in the chart below on the right side with the chart on the left showing the wedge. Without tight oil, the price regime must shift and the Age of Scarcity begins.
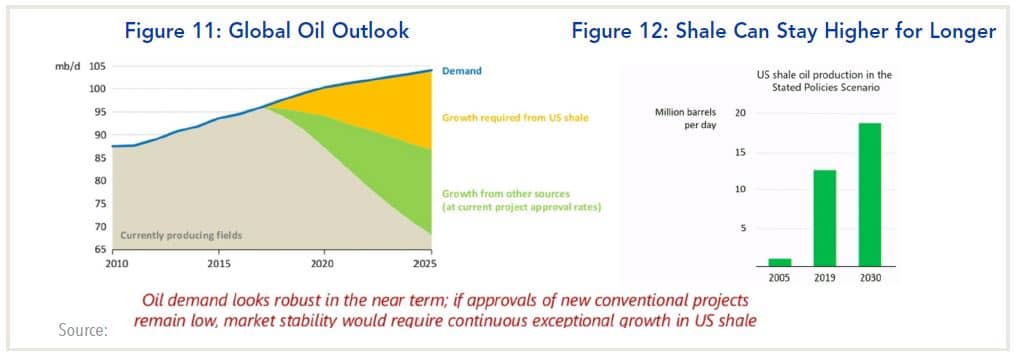
Some investors suggest that the market is efficient and that analysts understand this. We would submit, however, based on supply side viewpoints, that work done by the IEA, EIA, and others significantly influence the forecasts (and outcomes) by investment banks, consultants, and others. Where they lead, others typically follow. As tight oil collapses they will likely need to adjust their perceptions and face the reality that the Age of Scarcity is upon us.
The last major projects to be sanctioned were the offshore projects in Guyana, Johan Sverdrup in the North Sea, and Brazil back when oil prices exceeded $100/bbl. From 2000-2019 the global oil and gas industry spent over $2.6 trillion. As we stand at the precipice of the Age of Scarcity, and on the heels of the 2014-18 OPEC battle for market share, capital spending has fallen by 50%.
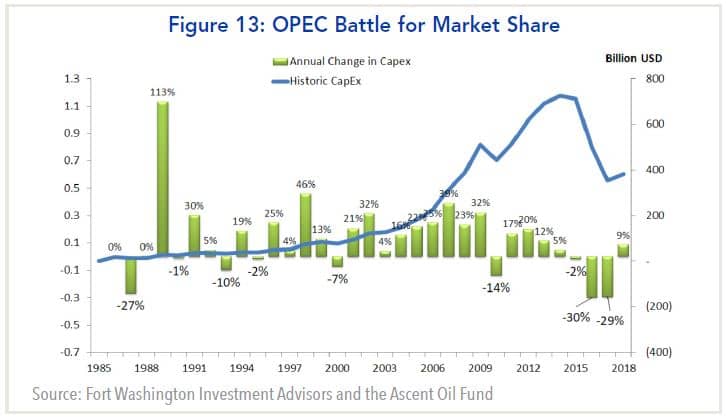
Without new projects being sanctioned, the recent tail winds (more like a breeze from the aforementioned offshore projects) will likely rapidly fade and by mid-2020 growth may be unable to offset base non-OPEC declines. This requires a shift in the price regime to reflect the Age of Scarcity and the collapse in tight oil production growth from double digits to single digits, at best, or negative most likely.
BMO provides another perspective (December 2018), but in line with what we are seeing. Non-OPEC producers commissioned under 2 mmbpd of new capacity in 2017. For 2019-21 they expect around 2.1 mmbpd of new production to come online, roughly offsetting or ever so slightly exceeding base declines of 1.9-2.0 mmbpd.
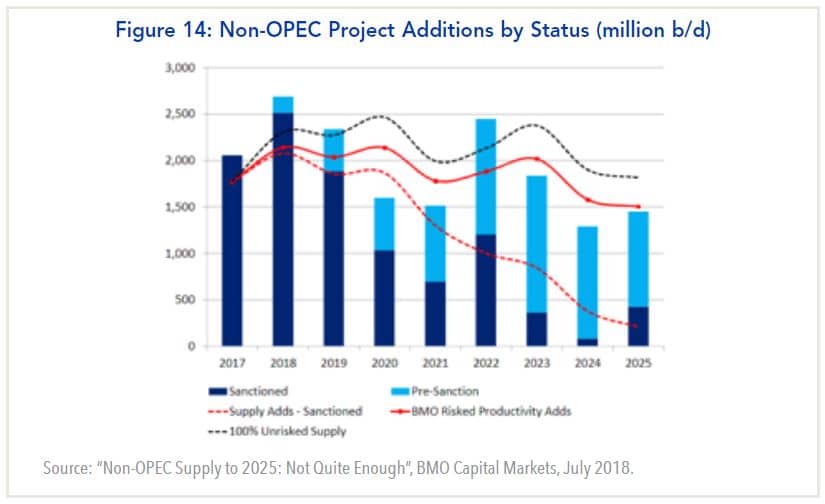
Simmons estimates (August 2019, chart on the left) that declines are closer to 2.3 mmbpd, which would imply that new production is failing to offset base declines as early as 2020. Simmons is far less constructive as is Goldman Sachs’ (right) latest outlook (December 2019). Both build their outlook from a bottom up perspective and indicate that non-OPEC growth will significantly lag non-OPEC conventional declines by 0.6-1 mmbpd over the next 5 years.
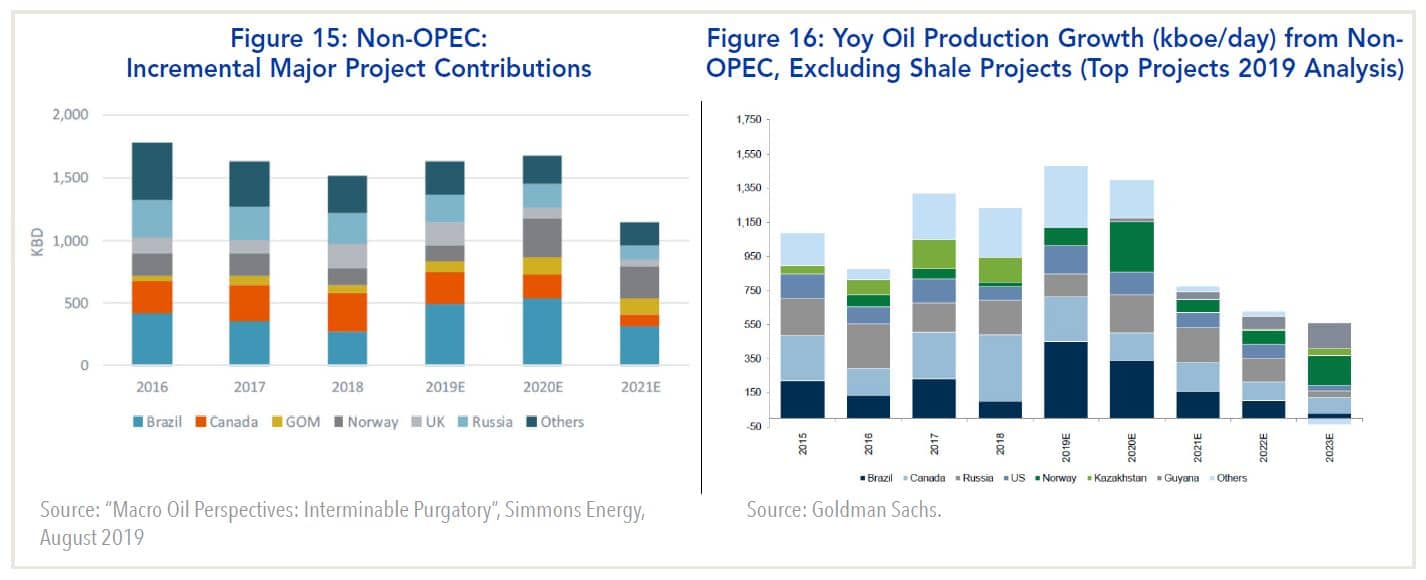
In other words, a bottom-up analysis provides a similar conclusion to that of the peak oil concept of depletion of the resource base. The rather simple conclusion is that supply growth will lag global declines and, with the curtain being pulled on tight oil, prices must adjust higher to bring supply and demand into an equilibrium. Unless the impact from COVID causes material and permanent demand destruction, we continue to expect that supply will lag demand in the near future.
Oil Allocation
There are no models that can address calling the bottom in this market. There is significant volatility in the price of oil and the level of uncertainty as it relates to demand, consumption, and supply. We believe this makes it nearly impossible to assess the near-term risks associated with investing in the oil sector. Long-term, we are very bullish. Near-term we are very cautious; however, we believe a reasonable floor for a barrel of West Texas is around $20/bbl with $30/bbl providing an upper bound. We can better assess how long it will take for inventory levels to return to normal once we have a better idea of how much crude and products have moved into onshore and offshore storage. Barring unexpectedly high levels, we think the market can move to $30-$40/bbl range as inventory levels are slowly reduced and low cost tight oil producers can slowly bring online some of their best wells.
Unlike the early days of COVID-19 when parallels were being drawn to H1N1 and SARS, we believe such parallels have little meaning given the nature of the lockdowns and impact on consumption. Layer into this the ongoing talks pertaining to production cuts (OPEC+ and non-OPEC), and we are facing a wall of uncertainty and a need for much higher discount rates in valuation models.
As was the case when we looked at a reasonable floor for oil prices, we think investors can look to history to guide their decision-making process as they consider allocations to energy. 2004-05 has interesting valuation parallels to today. Based on our view that we are standing at the cliff to an Age of Scarcity, we believe that value can be found by investing in the oil value chain. Simply put, prices need to go higher to incentivize exploration and development activity.
We like to look at the energy space by subsector. In general, we are avoiding companies with high levels of leverage and customer concentration, and we prefer large cap investment grade companies.
Exploration & Production
Prior to the impact from COVID-19 we found valuations compelling in Canada and the United States; however, we think the impacts from COVID-19 and the price war will be felt for several years. We look to 2004-05 valuation as a trough for companies. Prior to the early April jump in prices, we saw many companies approaching these levels. We prefer large cap without significant exposure to U.S. tight oil. We continue to see opportunities for consolidation in the U.S. (Permian specifically) where G&A/boe costs are 4x+ higher than Canadian peers.
Oil Field Services
Midstream
Integrated Producers
Refiners
22Depletion rates are a measure of the rate at which the recoverable resources of a field or region are being produced. When defined in relation to 1P reserves, the depletion rate is simply the inverse of the more familiar reserve to production (R/P) ratio. The IEA estimates that the giant oil fields in the world are, on average, 48% depleted, with peak production happening well before the halfway mark.
23Global Oil Depletion An Assessment of the Evidence for a Near-Term Peak in Global Oil Production.
24Ibid.
25Ascent Oil Fund, November 2019, Presentation and interview with Hedgeye.
26“Outlook for Energy: A Perspective to 2040,” Exxon Mobil, 2019.
27“World Energy Outlook 2017” International Energy Agency, 2017.
28“World Energy Outlook 2019 Press Conference,” https://www.youtube.com/watch?v=dxQy3vZ601I, Accessed November 20, 2019.


