- Small capitalization, or “small cap”, stocks represent the smallest 10% of the capitalization of the U.S. equity market, which includes companies with market caps to about $2 billion.
- Small cap stocks have generated attractive investment returns over the long term, but come with greater risks to consider.
- Less analyst coverage, low liquidity, capacity constraints, and volatility may account for the sources of greater potential return as well as risk. Thorough fundamental analysis may allow investors to uncover inefficiencies imbedded in small cap stocks, although information is not as readily available as with large cap stocks.
Small Cap Stocks Defined
Morningstar’s classification system divides equities into three capitalization categories – large cap, mid cap, and small cap. Large cap stocks represent stocks in the largest 70% of the U.S. equity market, and mid cap stocks represent the next 20%. The remaining 10% of the capitalization of the U.S. equity market are known as small cap stocks.
The small cap segment includes companies with market caps up to around $2 billion. While at the bottom 10% based on capitalization, the number of total companies that fall in this category is actually significantly larger than the total number of companies in the large cap and mid cap categories combined.
While it is inferred that small cap companies have market values that fall on the lower end of the spectrum of publicly traded companies, small cap companies can also be emerging growth companies, have significant share of niche markets, or niches in large but highly fragmented markets.
What Makes Small Caps Attractive?
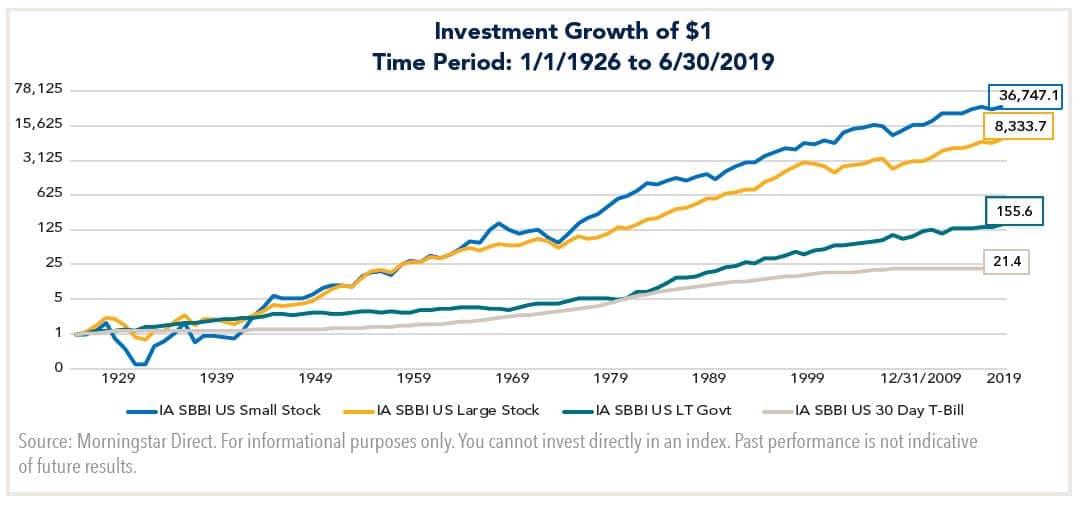
As can be observed in the chart below, small cap stocks have generated attractive investment returns relative to certain other asset classes and stock market capitalization segments over time.

| Cumulative Return | Annualized Return | |
|---|---|---|
| IA SBBI US Small Stock | 3,674,605.33% | 11.90% |
| IA US Large Stock | 833,267.17% | 10.14% |
| IA SBBI US LT Government | 15,455.83% | 5.55% |
| IA SBBI US 30 Day T-Bill | 2,041.79% | 3.33% |
Source: Ibbotson Associates data
What Are the Drivers of Small Cap Returns?
Startups that haven’t attracted significant capital yet or are just beginning to gain traction may standout as good buyout candidates to larger organizations. While this alone can be a source of significant alpha in a small cap portfolio, we believe research inefficiencies within the asset class offer the most compelling investment opportunities. These inefficiencies are due to several factors.
Another inefficiency is that fewer investment managers devote research resources to analyzing small companies. In addition to the high number of small cap companies, other potential hurdles such as less trading liquidity or shorter track records to substantiate their business models can inhibit research efforts.
A third efficiency factor that could make small cap stocks attractive investments is the volatility of their stock prices. Lower liquidity of small caps creates a supply and demand scenario that can cause large swings in share prices given sudden changes in sentiment. This presents significant opportunities for active managers to capitalize with their stock selection. Active portfolio management also presents the opportunity for diversification to minimize stock-specific volatility and risks.
Summary
Small cap stocks can generate attractive long-term returns but come with embedded characteristics that increase their risk profile. We believe careful fundamental analysis is necessary to:
- Recognize acquisition potential
- Identify and capitalize on inefficiencies
- Reduce the downside volatility


