


 Investors have piled into Money Market Funds at a record pace since the pandemic, driven by excess savings and attractive yields. (Figure 1)
- While Money Market Funds have performed well since the Fed began its hiking cycle, this trend is likely to shift as the rate cutting cycle approaches.
- Based on past cutting cycles, investors have benefited by extending duration before the Fed executes the inaugural cut.
- Recent inflation reports and data indicating a cooling labor market have increased investor confidence that the first rate cut will occur in September.
The Federal Reserve embarked on an unprecedented path of rate hikes in response to elevated inflation, which followed easy monetary and fiscal policy during the pandemic. Consequently, interest rates have experienced significant volatility and the yield curve has been inverted for the longest duration in history. This has provided cash investments with an extended period of attractive relative value. However, monetary policy is expected to reverse from its current positioning and ease over the next few years.
Now May be the Opportune Time to Extend Duration
Despite continued debate around the Fed’s terminal rate, the market anticipates the first cut to occur in September as inflation eases towards 2%. Consequentially, investors in money market funds will begin to see their yield decrease over the coming months and quarters. In addition, while cash has been a strong performer, past rate cutting cycles suggest that now may be an opportune time to extend duration.
Insights From Past Cycles
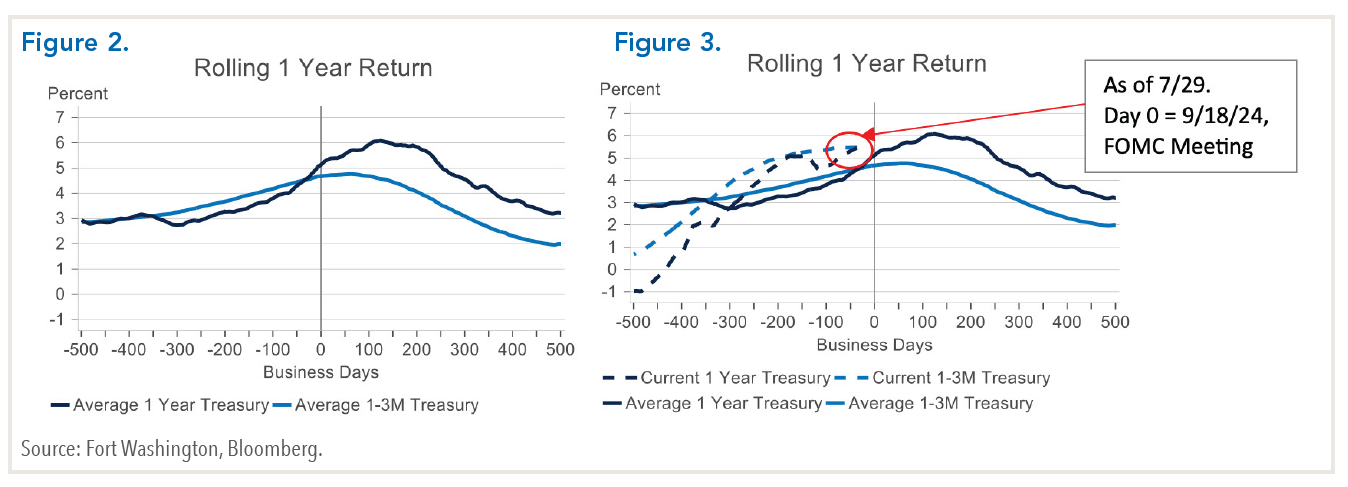
The chart below (Figure 2) compares the one-year cash return (1-3M Treasury) to a 1-year Treasury in the days surrounding the Fed’s first rate cut. Day 0 denotes when the first cut occurred with each line representing the average return over the past four rate-cutting cycles beginning in July 1995, January 2001, September 2007, and August 2019. As shown, cash tends to outperform a strategy with slightly more duration leading up to the first rate cut; however, that dynamic shifts right before the first cut is executed causing the yield curve to steepen. Moreover, that duration extension continues to generate excess return, averaging 1.25% to 1.75%, for years. Although this cycle may differ, the chart below (Figure 3) illustrates the current trajectory, assuming a cut at the September FOMC meeting, indicating that history is likely to repeat itself.
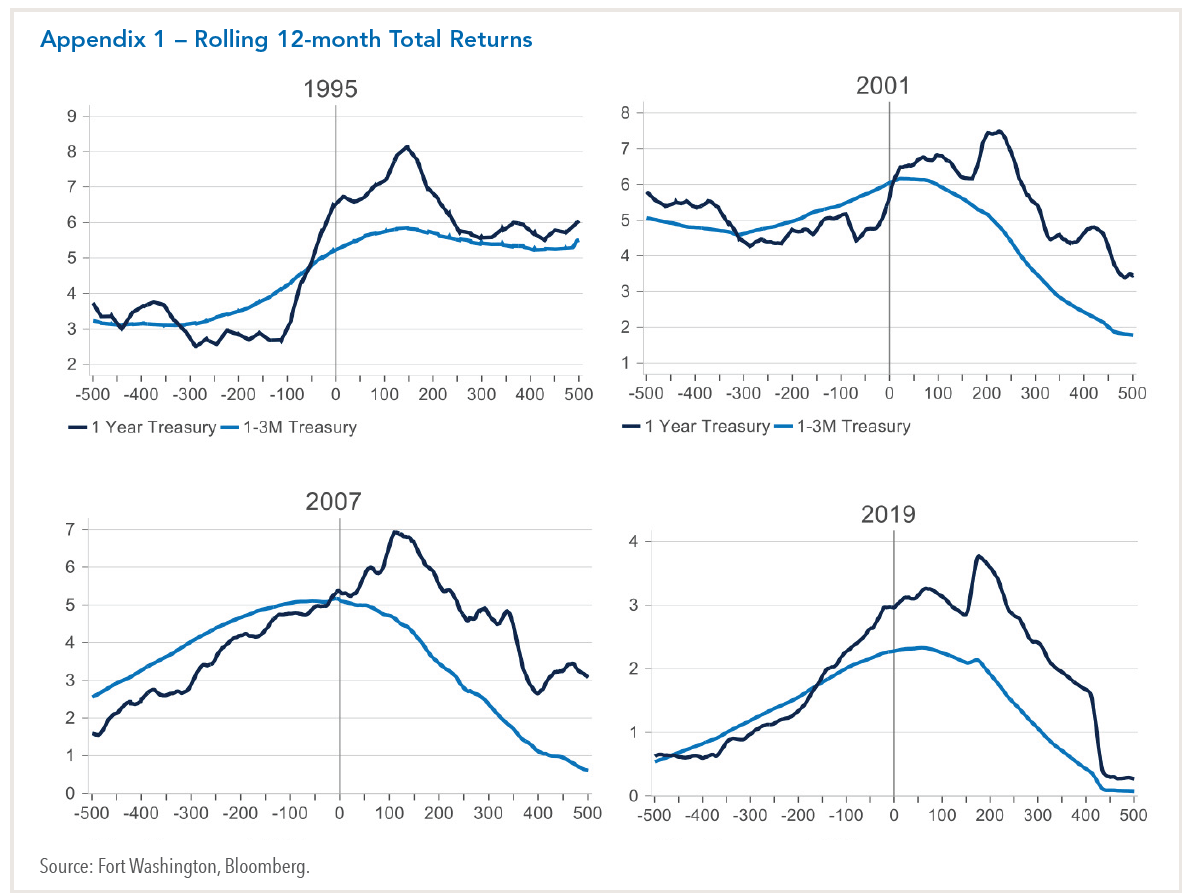
Furthermore, this performance trend was evident in each of the four cycles analyzed, including 1995, when the U.S. economy experienced a “soft landing,” and inflation was at a similar level (see Appendix 1).
Could This Cycle Be Different?
While historical data can provide useful insights, we also examined the current environment for an explanation of how this cycle could be different. Using a model, we projected money market returns compared to a 1-year Treasury portfolio over the next 18 months, assuming different Fed Fund paths. In a “base case” scenario (projecting 150 basis points of cuts through 2025), the one-year portfolio is expected to outperform cash by approximately 30-40 basis points over that time period.
Strategic Recommendations
While this base case for duration extension generates a modest amount of additional return, in our opinion, the more attractive finding is the difference between returns in an upside scenario (300 basis points of cuts) and a downside scenario (no cuts). In these extremes, we predict that the outperformance of a 1-year Treasury portfolio in the upside scenario is about three times larger than the underperformance if there are no cuts. The asymmetric return profile suggests investors are being compensated for extending duration.
Despite the perception that these extremes may appear unlikely right now, they illustrate an attractive relationship between risk vs return. The results offer additional evidence that rotating out of money market funds into longer, but still conservative, duration positioning appears timely and could enhance a portfolio’s total return.
Download Cash Investors - How to Enhance Your Returns
Download Cash Investors - How to Enhance Your Returns