


Oil Price Outlook for 2024
The oil market is largely balanced, due to OPEC cutting production by 5 million barrels per day (mmbpd), led by Saudi Arabia.1 OPEC is expected to maintain the cuts through 1Q24.2 We believe they must increase the cuts, and this underpins our forecast, which is illustrated in the figure below.

Source: Fort Washington.
Our bull and bear scenarios below incorporate geopolitical and economic events that we feel could impact the supply and demand dynamics of the market. Over time, these impacts would be observable through changes in global oil inventories and OPEC spare capacity.
OPEC spare capacity is estimated at 6 mmbpd.3,4 We would consider 4 mmbpd normal, with the market becoming concerned below 3 mmbpd.5 Spare capacity could increase to around 7 mmbpd in 2024 (led by the United Arab Emirates (UAE), Kuwait, and Saudi Arabia).6 This is not indicative of a tight market; rather, it is a market where OPEC can exercise control over the price of oil, barring a major supply disruption or disruption within the cartel. This is what we mean by the Sword of Damocles being hung over the oil market by Saudi Arabia.
Summary of Scenarios

Base Case/Status Quo
In our Base Case, geopolitical flash points simmer, but they fail to boil over. Pipelines and major projects, which are expected to come online in 2024, achieve their in-service dates as expected, and demand follows normal seasonal movements. Here we lean on work from various agencies to develop our demand outlook, which incorporates 0.6 mmbpd of growth from India and China, with Africa and the Middle East adding about 0.3 mmbpd. Other regions bring the expected growth in demand to 1.3 mmbpd.7 Estimates of global demand growth from various sources range from 0.5 to 1.5 mmbpd.
Additional non-OPEC supplies come to market in 2024 from the U.S., Canada, Brazil, and Guyana. Non-OPEC producers will likely add 0.9-1.8 mmbpd in 2024 (the upper range depends on timing for the TMX Expansion in Canada). OPEC producers will add about 1 mmbpd of new capacity in 2024; however, current production cuts could keep such capacity off the market. Combined, we could have ~0.9-2.8 mmbpd of global production growth.
We assume OPEC extends the 0.5 mmbpd 1Q24 cuts for the balance of the year, resulting in normal OECD inventory builds of around 20 mmbbl8 (a reasonable proxy for global inventories given the capacity available, especially in 2024 as China’s inventory levels are close to capacity).
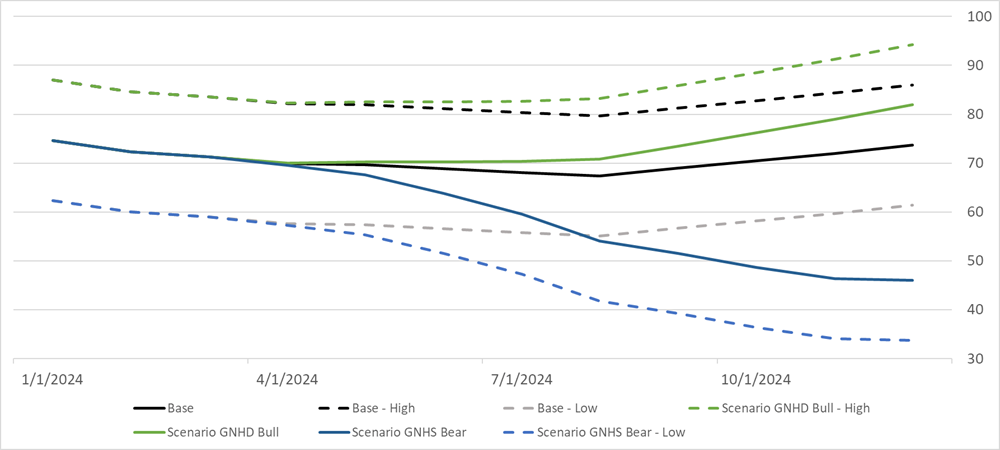
Our base case price forecast assumes a typical year, resulting in WTI around $70/bbl (Brent ~$76/bbl). Base-High and Base-Low reflect a one standard deviation move in the price of oil.
Oil Price Forecast Scenarios (WTI $/bbl)
Source: Fort Washington.
Bull Scenarios
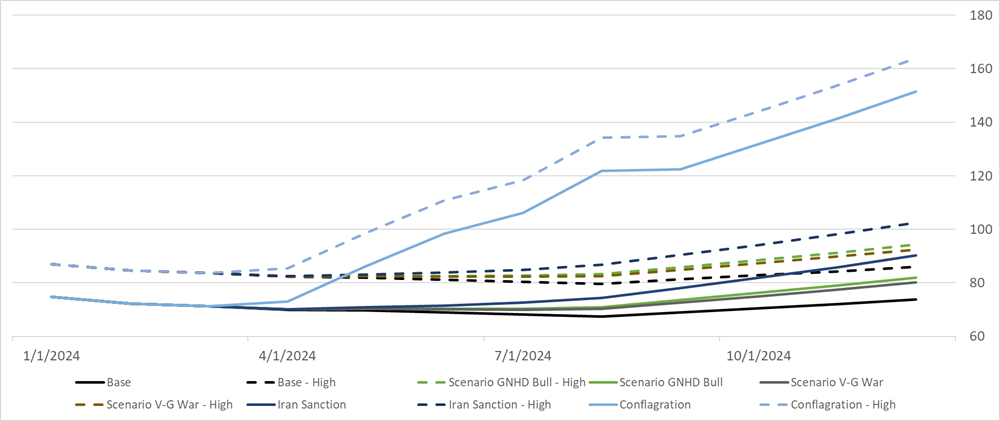
Oil Price Forecast Scenarios (WTI $/bbl)
 Source: Fort Washington.
Over the last decade it has been reasonable to focus on demand growth surprises from China as drivers of the oil market. We believe our base case scenario more than adequately accounts for China. Where we see room for the price of oil to move higher in the next 12 months is from geopolitical events, which curtail the available supply of oil, resulting in a material drawing down of global inventories and/or OPEC spare capacity. In each scenario we shock the model at the end of 1Q24.
While we model the smoothing out of a shock over time, reflecting inventory changes, the market is likely to pull forward price expectations.
1) GNHD Geopolitical Neutral With High Demand and Soft Supply
- This is a low probability event, given the need for a rapid deceleration of production growth plans for 2024 and strong global economic growth with a bias toward developing economies. Furthermore, this scenario affords no material changes to oil supply relating to ongoing geopolitical events as of January 2024.
- Average prices for 2Q-4Q edge slightly higher than our base case, with year-end prices almost $10/bbl higher.
- Global inventories are reduced by ~165 mmbbl.
2) Venezuela-Guyana War: Venezuela Seizes the Essequibo From Guyana
- This is our most likely Bull Scenario to develop, and we consider it to be a relatively high risk, medium impact, long-duration event due to the uncertain military response. Where we see additional risk to oil prices is beyond 2024 as Guyana’s (now Venezuela’s) reserves fail to be developed and producers need to look elsewhere to offset their declining production and reserve base.
- The Venezuela-Guyana conflict is simmering. Venezuelan President Nicolas Maduro pledged not to use force in its dispute with Guyana over the Essequibo region; however, the Venezuelan government likely views this late 2023 agreement as violated after Guyana welcomed the HMS Trent into its waters. The Essequibo contains vast mineral and oil deposits including inside the exclusive offshore economic zone. Current production (end 2023) is around 600,000 bpd with plans to bring production to 650,000 bpd in late 2024.
- Maduro faces an election in 2024, and the increasing rhetoric is reminiscent of Russian rhetoric prior to the invasion of Ukraine. Maduro has provided Exxon and others with 90 days to leave (late February) the Essequibo.
- If an invasion comes, we think it happens by the end of March. Production in April, using Libya as an analogy, suffers a material collapse before recovering. Based on the limited impact from sanctions on Russia, it is plausible to assume that exports resume in 2024. Due to staffing issues (and likely sanctions), we aren’t projecting a full recovery in production. The net result is a loss of 90 mmbbl in 2024.
- Average prices for 2Q-4Q edge slightly higher than our base case, with year-end prices just under $10/bbl higher.
3) Iran-Sanction: Aggressive Enforcement of Secondary Sanctions on Iran
- This is our second most likely Bull Scenario to develop; however, given the uncertain response to nations whose companies are impacted by secondary sanctions, we believe the current U.S. administration would be reluctant to act until much later in 2024.
- While the U.S. Treasury is actively enforcing primary sanctions on Iran, they are not aggressively enforcing secondary sanctions.9 It is our understanding that enforcing secondary sanctions would require the U.S. Treasury to apply sanctions on Chinese refineries and shipping companies. We believe that Iran, and others, have observed the changes to shipping after sanctions on Russia and adapted. As a result, we believe the enforcement of secondary sanctions against Iran is a difficult, but not impossible, move for the U.S. government.
- Enforcement of secondary sanctions could result in a 1.2 mmbpd shock to the oil market.
- Average prices for 2Q-4Q are almost $10/bbl higher than our base case, with year-end prices just over $20/bbl higher.
- Global inventories are reduced by ~330 mmbbl.
4) Conflagration: Strait of Hormuz Trumps the Bab-El-Mandeb Strait With 21,000,000 bpd at Risk
- This is our least likely Bull Scenario to develop, but it would have the highest impact on global oil markets.
- The Strait of Hormuz touches almost 20% of global oil flows, making it a critical artery for the global economy. While the Bab-El-Mandeb Strait is important for flows to Europe, as we have seen, the Strait can be avoided without having a material impact on volumes. This is not the case for the Strait of Hormuz. A regional conflict, or blockade of the Strait, would likely result in a tremendous military response. We shock our model, taking 21 mmbpd offline in April. Most of this returns to the market, but we assume 2.8 mmbpd of reduced exports following the conflagration due to regional demand and upstream supply destruction.
- Average prices for 2Q-4Q are $40/bbl higher than our base case, with year-end prices almost $80/bbl higher.
- Global inventories are reduced by ~1,300 mmbbl.
Bear Scenarios
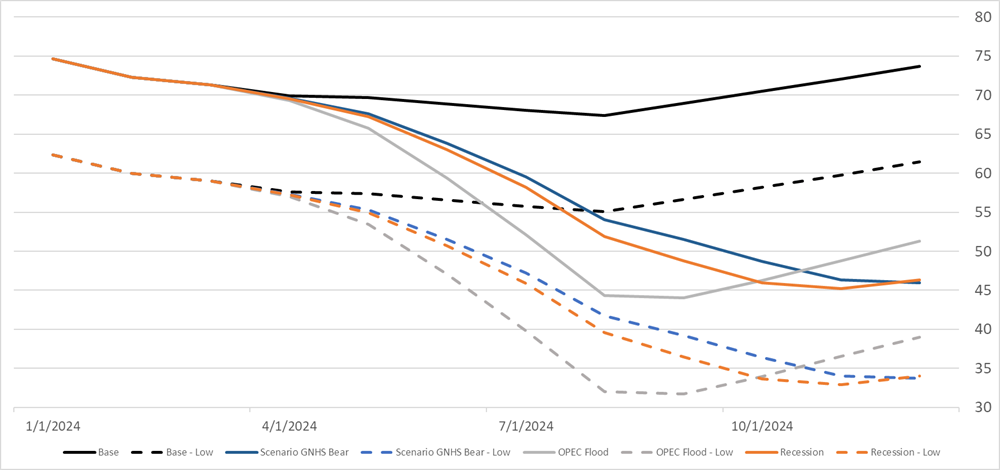 Source: Fort Washington.
Our bearish scenarios, like the bullish scenarios, seek to provide a book end for downside risk to the oil market. We shock supply/demand which in turn flows into inventory levels, impacting prices. Like the bull scenario the shocks start after 1Q, in April.
1) GNHS: Geopolitical Neutral With High Supply and Soft Demand (But Not a Recession)
- We consider this a medium probability event. It reflects the high supply estimates that we previously provided and incorporates the lower end of the demand estimates. Essentially, projects that are starting up or being readied for 2024 proceed as planned and flow into the market, this includes OPEC production growth which we acknowledge might be held back, increasing spare capacity, reducing the impact on oil prices in our model.
- Average prices for 2Q-4Q are almost $15/bbl lower than our base case, with year-end prices down by more than $25/bbl.
- Inventories build by 630 mmbbl.
2) OPEC-Flood: Battle for Market Share or Cartel Collapse, the 1980s Analogy
- This is our most likely bearish scenario for 2024, and barring a Venezuelan invasion of Guyana, we would consider this the most likely scenario to develop. (Because we find the history of previous OPEC battles for market share fascinating, and an excellent parallel for a potential 2024 battle for market share, we have devoted the appendix to background information on these events and their impact on oil markets.)
- In this scenario, cartel cohesion rapidly breaks down like it did in the early 1980s. OPEC floods the market but keeps spare capacity above 3 mmbpd.
- Average prices for 2Q-4Q are $17/bbl lower than our base case, with year-end prices down by $22/bbl.
- Inventories build by 840 mmbbl.
3) Recession: Global Recession Reduces Overall Demand
- Estimating the timing, and magnitude, of recessions is an inherently difficult business. Like our other scenarios, we are shocking the system after 1Q to observe the impacts, thus providing us with relative movements in the price of oil should such a scenario develop. Looking back at recessionary periods, we believe it is reasonable to shock demand by around 10 million barrels per month. Since production responses tend to lag demand responses by several months, we start with the GNHS Scenario then curtail demand by another 10 mmbbl per month, assuming no production response within our forecast period.
- Average prices for 2Q-4Q are $15/bbl lower than our base case, with year-end prices down by almost $30/bbl.
- Inventories build by 730 mmbbl.
Natural Gas & LNG
Warm weather will have a material impact on the natural gas market in North America and Europe for 2024. El Niño conditions are present and strong. This tends to reduce natural gas consumption in North America and most of Europe. Scandinavia and Russia are likely to be colder than normal, but their impact on the natural gas market will be negligible. It is very difficult for the natural gas market to recover from a warm start to the winter. We have crossed this line for Europe and are close to crossing it for North America. As a result, hub prices could fall below $2/Metric Million British Thermal Units (MMbtu) this winter and $12/MMbtu in Europe.
The warm weather will carry throughout 2024. Europe will likely have a summer season akin to 2023 where storage levels start the injection season at over 50% (above normal) with North America well above the 5-year average.
Demand for natural gas in the U.S. and Canada will be driven by new LNG projects, expected to start-up in 2H24. These include LNG Canada, Golden Pass, Plaquemines, and Corpus Christi 3. These four projects will add 20% to the global LNG market. Mexico should bring online some capacity in late 2024, with more coming in 2025.
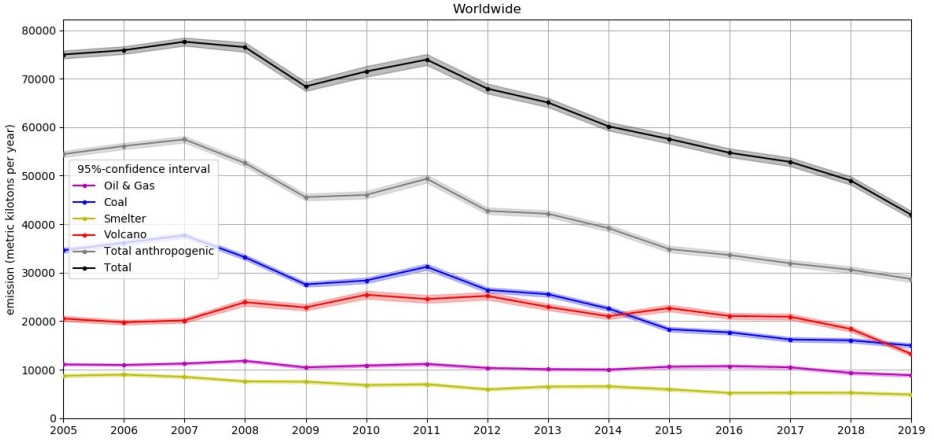
The International Maritime Organization (IMO) 2020 fuel standards were implemented at the start of 2020. These global standards limited the amount of sulphur content permitted in fuel oil for shipping. This was a significant reduction, estimated to reduce global sulphur oxide (SOx) emissions by 8.5-8.9 MT10; global SOx emissions at the time were estimated to be 50 metric tons (MT) of which 21% are from the Oil & Gas industry (which includes transportation). The reduction in emissions is equivalent to around 64% of the SO2 from volcanic activity in 2019.11
Global Sources of SO211
Global Mean Temperature Responses to 1 Year Pulse Emissions of CO2 and SO2 From Shipping12
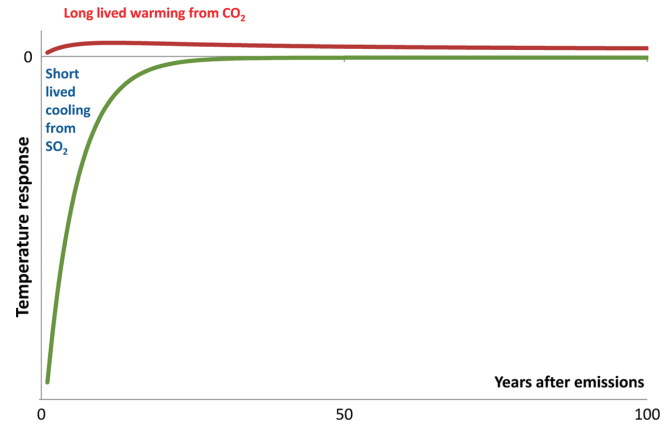
It takes a few years for the full impact from changes in aerosols to be felt. The temperature response to a change in emissions is illustrated in the figure to the right. This shows how CO2 and SO2 operate differently over time due to the thermal inertia that sulphur emissions have on oceans with SO2 emissions having a much shorter timescale. “If for some reason (e.g., health issues, ocean acidification) the SO2 emissions must be reduced, future generations are beset with a warming effect that may be difficult to curb”.12 The degree of warming will depend on the direct and indirect effects of clouds, rain, and solar radiation. Current research remains somewhat inconclusive “[w]e thus conclude that the effect of the IMO 2020 regulations has been clearly detected in the large-scale cloud microphysics and that there is strong evidence for a decrease in cloud brightness, although more years of data may be required for unequivocal detection of changes in overcast albedo.”13
This raises the uncertainty around natural gas demand, and thus prices and volume growth. Research from the International Panel on Climate Change, or IPCC, estimates the impact on global temperature from SO2 to be around 0.5 to 1C.14
SOx Reductions Could Reverse 0.5C to 1.0C Average Global Cooling—Observed Warming is Driven by Emissions from Human Activities, with Greenhouse Gas Warming Partly Masked by Aerosol Cooling

Source: Intergovernmental Panel on Climate Change.
This type of situation would undoubtedly be bearish natural gas demand. In discussions with various energy companies, none have indicated plans to reset internal baseline assumptions (rolling 5-year averages) for heating degree days.
How much of a reset remains uncertain, but we think it could be a 10-20% reduction in heating degree days, necessitating less LNG exports from the U.S., and less demand for natural gas from the Haynesville or other higher cost basins.
It is possible that the reduction in cloud coverage associated with less SOx could be a contributing factor to the lower quantities of rainfall in some regions, such as around the Panama Canal.
"Large scale reduction in SO2 emissions over Europe coincided with a cloud cover reduction of ~5% and an increase of annual sunshine hours of ~75 hours per year.”15
It is too early to determine if this is contributing to the local drought conditions impacting the Canal, but if it is a contributor then the temporary issues impacting the Canal will be permanent.16 The U.S. Army Corp of Engineers is working with the Canal to reroute water supplies from another lake in addition to investigating the potential for cloud seeding.17 This is bullish for LNG shipping, as it increases the amount of time it takes for cargoes to travel to a destination and back. This could become bearish for natural gas producers in North America if it overly tightens the LNG market and causes natural gas to back up.
Panama Canal Issues Require More Vessels
Emerging Trends in LNG Shipping—New Supply Targeting the East Requires More Vessels, Especially if Panama Limits Persist
- Price elasticity and new supply that will see greater volumes delivered to the more distant East.
- Tailwinds from logistical bottlenecks such as the Panama Canal.
- Impact of new Russian supply on the market?
 Sources: Cool Co Ltd., Clarksons Research.
If global temperatures have not shifted higher from IMO 2020, then U.S. producers and midstream operators with assets in the Haynesville Basin should benefit relatively more than producers in the Marcellus or Permian Basins, while midstream operators and E&Ps in Canada will benefit when LNG Canada comes online. The Haynesville Basin is likely the most at risk if IMO 2020 impacts result in higher baseline temperatures, which is partly due to its proximity to proposed LNG export terminals and partly due to its higher costs.
Appendix: The Great OPEC Flood – Understanding the Past
The flooding can take many forms. In late 2014, the oil market was oversupplied, and the expectations for 2015 were of a market that would see an even larger supply/demand imbalance as Iranian barrels were anticipated to return to the market. In the lead up to OPEC’s 166th meeting (November 27th, 2014), market participants expected OPEC to cut production and balance the market18 as they did in mid-to-late 2013. In some ways, this paralleled the late 1970s and outlook for the early 1980s. OPEC was reducing production to balance the market, only to see non-OPEC producers offset production cuts and capture market share.
OPEC Production (mmbpd, RHS) OPED Market Share 1970-2023 (%, LHS)
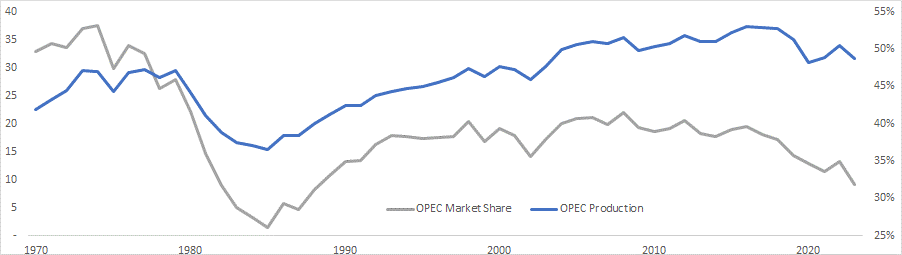
Source: Energy Institute, Bloomberg, IEA, Fort Washington.
In 2020-23, we see parallels of the 1970s-80s and 2010-14 periods. Both periods ended with a surge in production from OPEC and a collapse in prices. One was short lived the other lasted much longer.
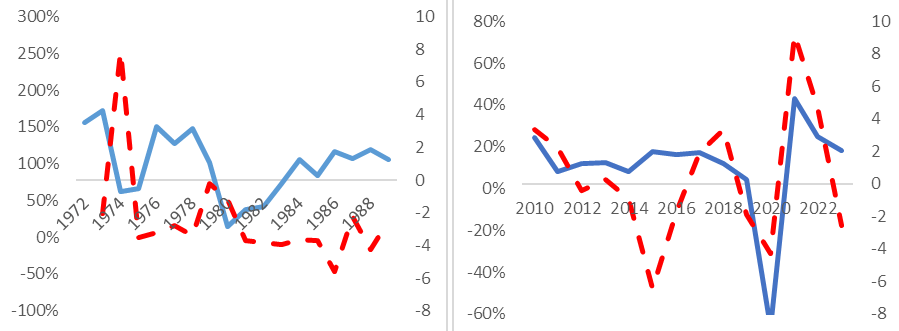
Oil Prices (WTI, $/bbl) % Change (dashed line, LHS)
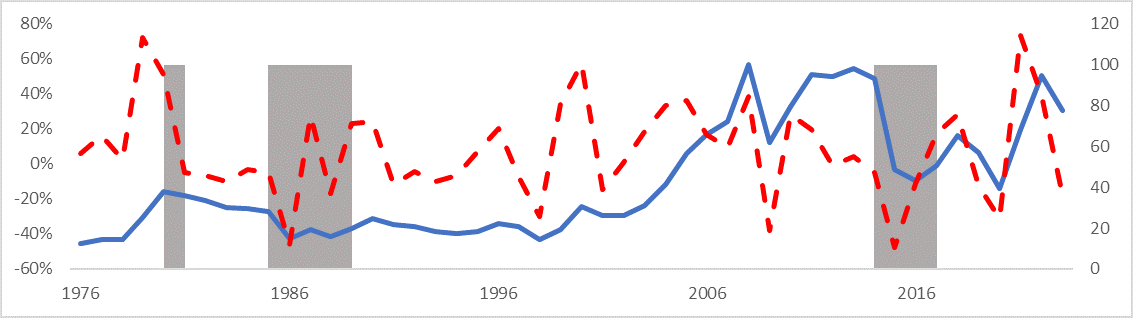 Source: Energy Institute, Bloomberg, Fort Washington.
The 2014 flood started as a trickle when OPEC failed to reach an agreement on cuts. Market expectations shifted, and prices fell.19 Months later, higher production followed with a multi-year period of low prices as OPEC sought to maintain market share.20,21 As 2017 approached, it was becoming clear that OPEC’s attempt to drive out competitors had failed. Tight oil producers in the U.S. responded to low prices by reducing costs and increasing output. OPEC, led by Saudi Arabia, invited Russia and other producers to work together to arrest the decline in prices. While OPEC had made overtures to Russia in the past, this was the first time Russia joined forces with OPEC. Prices moved higher, but the cartel had failed in its objective and the members "blinked."
"Prices have to fall a long way and price expectations have to remain depressed for a long time for a significant improvement of the market share of those who launch an oil price war."22
Annual Growth in Oil Consumption (dashed line is trend) mmbpd
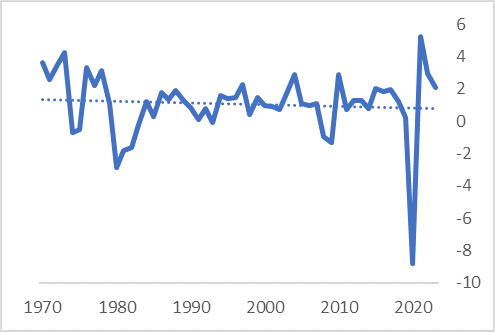
The 1980’s price crash was exasperated by demand weakness, while 2015-17 was a period of above trend demand growth (as illustrated in the chart, trend demand growth is around 1.2-1.3 mmbpd). The production surge(s) (1980 and 1986) were, we believe, an intentional act designed to recapture market share instead of supporting a price range. Production increases happened in two tranches, first in 1980 and the second in 1986.
The increase in OPECs production in 1980 was a response to the surge in oil prices,23 which coincided with strong demand growth. OPEC members, presumably, believed that future demand growth was set to continue, however the sharp increase in prices in 1980 contributed to a contraction in demand from 1980-86,24 and collapse in the price of oil from $36/bbl to $15/bbl.
OPEC producers dramatically curbed production from 1980-86, while non-OPEC producers continued to increase production and thus capture market share.
"The point that Saudi Arabia has been making consistently since 1985, backed by its policy in 1986 which was a genuine price war, seems to have sunk in. Saudi Arabia's willingness to cut output on its own to influence the course of oil prices could not be taken for granted. In fact, nobody could realistically expect to see such willingness ever emerging again."
In the 1970s, demand destruction occurred (1973 oil embargo) in which the annual change in oil consumption flipped negative; however, it rebounded quickly once the embargo was lifted. While prices increased from ~$2.5/bbl (1972) to $12.2 (1976), consumers rapidly adjusted to higher prices. From 2015-19 prices averaged, $53.0/bbl, nearly doubling in 2022 to $94.6/bbl. Like the late 1970s, demand growth slowed but there was no material demand destruction.
Changes in Oil Consumption Growth (Blue, mmbpd RHS) % Change in the Price of Oil (Red)
Source: Energy Institute, Fort Washington.
The initial OPEC response in 2022 remind us of the 1980 response. At that time OPEC increased production on the expectation of continued strong demand growth only to reverse course with the curtailment of output, and being forced to watch non-OPEC producers increase production and take market share. It would appear that Saudi Arabia’s willingness to cut production to benefit others has re-emerged, but for how long?
Expectations for Peak Oil Production Shift to 2024-28
This brings us back to our June 2020 report where we stated that “OPEC is being reborn, and despite the tremendous drop in demand for oil and oil products [due to COVID-19], long-term fundamentals for oil have improved as the price of the commodity has collapsed.” The pandemic and reduction in demand has shifted our view of peak oil supply from 2020-24 to 2024-28. All things being equal, such a period ought to support sustained higher prices. However, weakness in demand growth and spare OPEC capacity leaves OPEC in a position of significant market power, as was the case in the 1980s. Market participants are aware that OPEC could flood the market with additional barrels.

Source: Fort Washington.
If OPEC decides to flood the market with an additional 3-4 mmbpd (keeping spare capacity above 3 mmbpd) we estimate that oil prices would weaken materially. This flooding of the market would not be without precedent, and we think 1986 is a strong analogy.