


Highlights
- Fixed income markets have remained volatile this year as incoming economic data has caused the market to adjust its expectations for monetary policy.
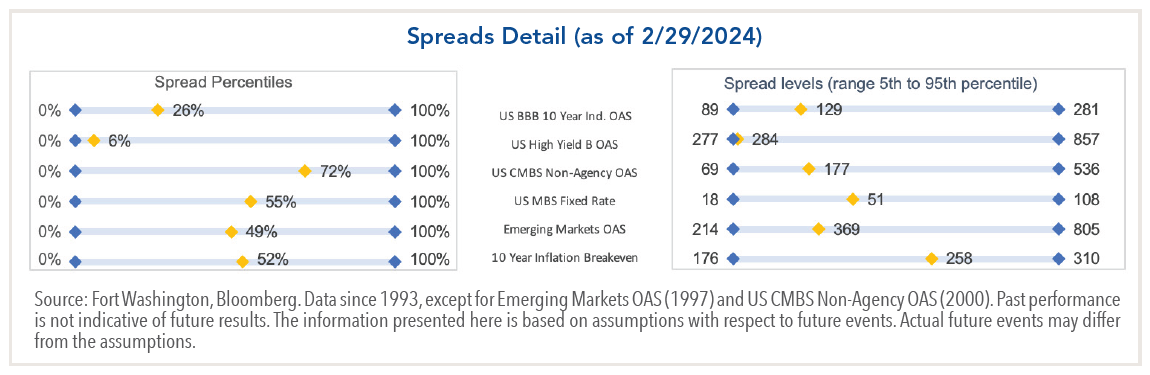
- The soft landing narrative continues to be the consensus as consumer strength has remained healthy. As a result, credit spreads are at generally tight levels with limited upside.
- While inflation has trended toward 2%, and recent data (6-month annualized) indicates we have already reached that target, the Fed has been hesitant to declare victory.
- Financial conditions have eased but remain tight due to restrictive monetary policy and bank-lending standards, which may weigh on economic growth.
Outlook
- We believe the expectations for a soft landing, or at least sluggish growth, are warranted and have become more likely given recent economic data. However, with credit spreads near historically tight levels, investors are not being compensated for the risks of a broader slowdown.
- Monetary policy’s full economic impact is typically subject to lags. With this in mind, it is not surprising to see an economy that has remained relatively stable given the amount of stimulus injected into it during the pandemic, how quickly the Fed raised rates, and that it has only been 7 months since the last hike. Over the last three recessions (excluding COVID-19), the U.S. has typically entered a recession 13 months after the last rate hike.
- Expectations are still for growth to slow into the first half of 2024 and a recession is not completely off the table, especially if the Fed keeps rates high for longer. The key to the degree of slowing will be the strength of the consumer. Markets will look toward incoming data to determine how much spending capacity remains (e.g. savings, credit usage & delinquencies, and consumer confidence).
- While the impact from rate hikes has been felt more immediately in certain sectors, such as housing, others will likely be weakened the longer rates remain elevated. A decrease in mortgage rates below 6% (currently over 7% according to Bankrate.com) would likely be a mechanism for increased economic activity as housing turnover increases.
- Although it does not appear geopolitical disorder at its current stages will materially impact U.S. asset prices, it does present a concern that additional escalation or conflicts could drag on global growth or impact inflation through supply side shocks.
- We expect security selection to be the main driver of alpha for fixed income managers while credit spreads remain range bound and tight across most sectors.
Multi-Sector Positioning
- In our multi-sector fixed income portfolios, we continue to target a moderate overweight to relative risk (i.e. 40% of the risk budget). Markets are pricing in a high probability for a soft/no landing, resulting in spreads at historically tight levels with risk/reward skewed to the downside.
- Fixed income portfolios were adjusted from being managed long duration to targeting a more neutral posture as we believe long rates are more fairly valued. However, we expect there will be continued opportunities for tactical adjustments as the market adjusts its expectations for rate cuts. From a key rate perspective, portfolios are still positioned for a steepening, but to a lesser degree than at year-end.
Strategic Income. The strategy reduced duration following the strong rate rally at the end of 2023 and is targeting a level around 4.5-5 years, down from over 5 years. The strategy exited its HY Credit Default Swap Index protection, but is maintaining overall HY credit exposure near 10% by reducing cash bonds in the sector. Conviction positions include BBB rated subordinated banking/utility, Emerging Markets Debt high yield, and non-agency ABS/CLO/CMBS.
Core Plus Fixed Income. Core Plus has maintained credit risk so far in 2024 with the most meaningful adjustment being tactical interest rate management. The strategy remains overweight with the high yield segment of Emerging Markets Debt as an alternative to domestic High Yield and continues to favor non-agency securitized sectors (i.e. ABS/CLO/CMBS).
Core Fixed Income. The strategy reduced its Investment Grade Credit exposure last year following strength within the sector, but it continues to be a modest overweight. Following the shift in relative value between CMBS and RMBS this year, the strategy is modestly reducing CMBS and allocating that to agency RMBS paper.
Intermediate Fixed Income. The strategy reduced its Investment Grade Credit exposure last year following strength within the sector, but it continues to be a modest overweight. Structured products are underweight due to lower exposure to Agency RMBS, but at a more detailed level we are overweight high quality non-agency CMBS.
Single Sector Positioning
Emerging Markets Debt. EMD has maintained a modest overall credit risk profile (35%-40% spread beta) over the past few months. Investment grade and BB spreads trade close to historical tights but we are finding value in certain high yield credits. Ongoing geopolitical conflicts in the Middle East and Ukraine continue to cause volatility in spreads and in the energy market. The strategy is underweight China given their negative policy dynamics, which has created opportunities for other countries in the region (India, Indonesia, and Vietnam) as well as Mexico, where we have an overweight stance.
High Yield. Portfolio activity is focused towards maintaining a higher quality bias and a preference for less cyclical exposure as we expect defaults to increase over current levels. Although we anticipate corporate defaults to be lower than previous cycles, we believe prices are not fully compensating investors as spreads are near historical tights, outside of CCC credits.
Active Corporate. The strategy still has an overweight risk bias relative to the index, but overall risk levels are being decreased in favor of higher quality issuers following the significant spread tightening experienced over the last few months. The strategy remains comfortable going down in credit within defensive, less cyclical sectors such as staples, utilities, and healthcare while also adding to select opportunities in cyclicals, technology, and financials on weakness.
Securitized Products. Most non-agency sectors lagged the corporate rally late last year but have experienced meaningful spread tightening in 2024. However, there are still pockets of attractive relative value. The strategy has biased credit quality up given the credit curve (AAA, AA, etc.) has flattened and investors are not being compensated to take on additional risk across much of the sector. We continue to favor non-agency exposure with an underweight to Agency RMBS. Deep discount AAA-rated non-agency RMBS offers compelling value as does high-quality CMBS that has widened in concert with broader CMBS disruptions from distressed office properties across the sector.
Economic Update and Market Performance
-
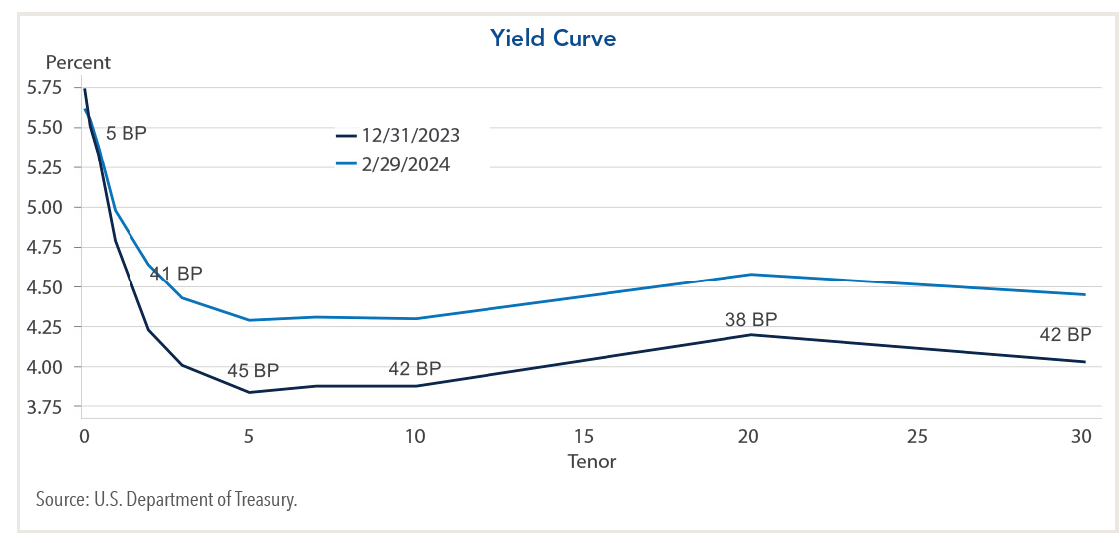
Off the heels of the strong rally that wrapped up 2023, rates moved higher to start the year. Yields reinforced the trend following December’s CPI, which came in a bit above expectations, due to shelter modestly resisting the suggested trend lower that real time data has been indicating. Additionally, we received a strong retail sales print mid-month, which was another catalyst for yields to continue increasing. January’s CPI release reiterated December’s print as core also surprised to the upside due to shelter remaining elevated.
-
The initial Q4 GDP print indicated consumer strength remains robust, supporting the economy’s above trend growth. American consumers reduced excess savings further and increased debt to fuel this activity.
-
Rates briefly declined at the end of January after PCE inflation showed continued progress toward 2%; however, this rally was short lived.
-
Aligning with the market’s expectation, the Federal Reserve kept rates unchanged at their meeting on January 31. However, Chairman Powell surprised markets when he indicated FOMC members would likely not gain enough confidence around the path of inflation to cut rates in March. He reiterated this view a few days later in an interview on “60 Minutes.” This caused rates to increase swiftly as the market adjusted its expectations for Fed policy. We entered this year with the market anticipating over 150bps of cuts through 2024, but currently have less than 100bps priced in.
-
In early February, the BLS released its nonfarm payrolls report that showed a strong and unexpected increase. Simultaneously, a University of Michigan survey showed consumer confidence was improving. These releases confirmed the Fed’s stance to hold rates steady and caused rates to continue rising.
-
Credit spreads experienced a bit of volatility but remained range bound at relatively tight levels as expectations for a soft landing remain consensus. Many non-agency structured sectors tightened significantly this year as they catch up to the corporate market performance from late last year.
This publication has been distributed for informational purposes only and should not be considered as investment advice or a recommendation of any particular security, strategy, or investment product. The securities identified do not represent a complete list of all securities purchased, sold, or recommended; please contact Fort Washington for a complete listing of securities held, sold, or purchased over the last year. Opinions expressed in this commentary reflect subjective judgments of the author based on the current market conditions at the time of writing and are subject to change without notice. Information and statistics contained herein have been obtained from sources believed to reliable but are not guaranteed to be accurate or complete. Past performance is not indicative of future results.
© 2024 Fort Washington Investment Advisors, Inc.


