Highlights
- Higher Stock Prices: Markets were largely encouraged by the U.S. election outcome and proposed policies, specifically tax cut extensions and deregulation.
- Small Cap Optimism: The Russell 2000 is outpacing the S&P 500 by over 4% this quarter and is also outperforming over the past twelve months.
- Tariffs: The President-elect, Donald Trump, has mentioned numerous policies, including immigration and tax cuts, but the one that has gotten a lot of attention recently is tariffs. In this month's Spotlight, we look at the impacts on inflation.
- U.S. Exceptionalism: U.S. equities have outperformed the rest of the world by about 25% over the past 2 years, but currently appear expensive compared to the rest of the world.
Table of Contents
Macro Insights
Election Fuels Further Upside
Stocks rose significantly in November, adding to already impressive year-to-date gains. The U.S. election results were viewed positively, driven by optimism around the likelihood of deregulation and more favorable tax policies. While U.S. corporate tax rates may not decline from current levels, the 2017 tax cuts, which are set to expire in 2025, have a better chance of being renewed, at least partially.
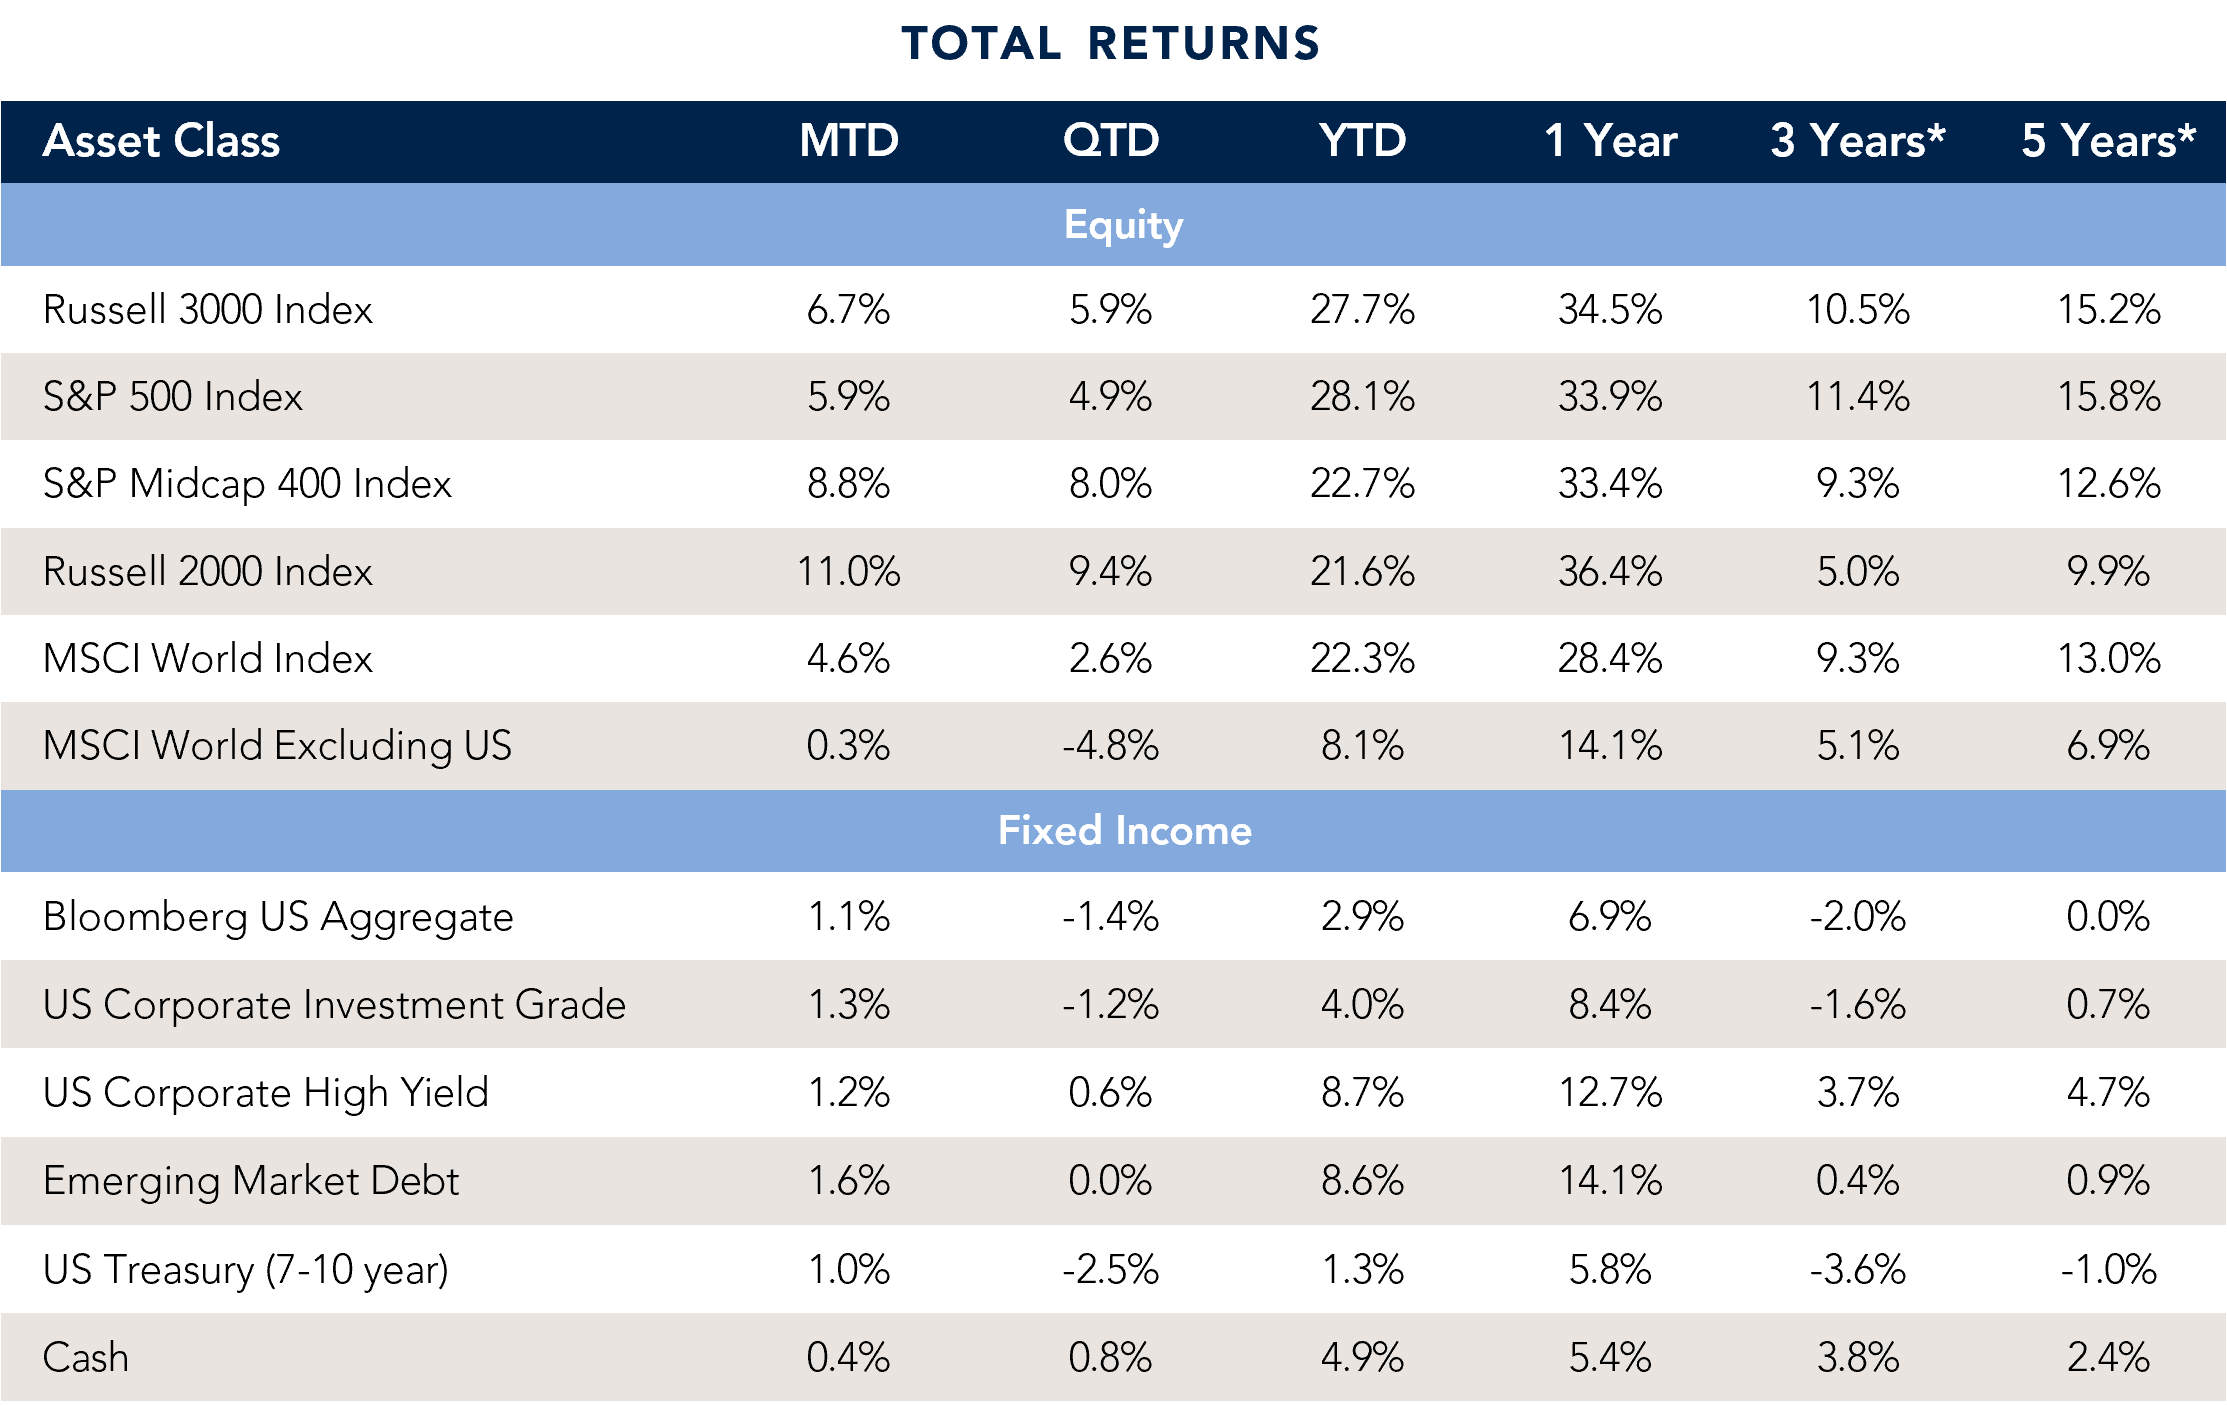
Small caps led the month's gains, rising nearly 11%, compared to a nearly 6% gain for the S&P 500. These smaller companies derive a larger share of their revenue and profit from the U.S., positioning them to potentially benefit more from favorable corporate tax policies, an “America First” agenda, and the possibility of increased mergers and acquisitions under a new administration.
At the sector level, consumer discretionary performed best, rising over 13%, largely due to Tesla's 38% rise on the month. Financial stocks followed, up 10% on expectations of a more favorable regulatory environment. Industrial and energy stocks also outperformed, while healthcare remained flat amid concerns over increased scrutiny of big pharma following the nomination for the head of Health and Human Services.
While the market has broadly viewed the election results as favorable, there are clear winners and losers, along with lingering uncertainty about the impact of potential tariffs. This month’s Spotlight explores how tariffs could influence inflation. The market has priced in some probability of broad tariffs on China, especially for companies heavily reliant on Chinese goods. However, which of these threats will materialize remains unclear.
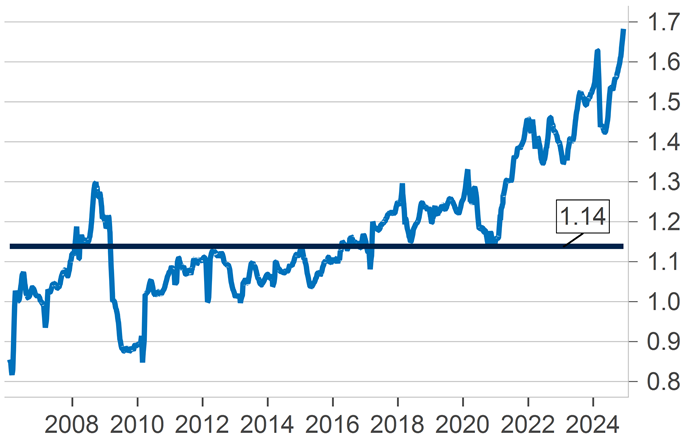
Equity market gains in November further stretched already high valuations in the U.S., especially compared to the rest of the world. This is reflected in the expanding price-to-earnings ratio premium the U.S. carries relative to non-U.S. markets (see chart below).
Long-term rates declined slightly from the levels seen a month ago. Despite this, expectations remain for modest Federal Reserve (Fed) rate cuts through 2025 (around 0.75%). Should inflation continue to cool, and tariffs prove less impactful, markets could end up pleasantly surprised. With a strong earnings season now behind us and economic data showing resilience, much attention is likely to focus on the priorities of the incoming administration.
U.S. Valuation Premium Extends Further
S&P 500 Price/Earnings Ratio relative to the rest of the world’s, and median ratio since 2005.
S&P 500 PE Ratio Relative to MSCI ex USA

Source: Fort Washington, Bloomberg, and Macrobond.
What to Watch
Labor market data will continue to be a focus over the month ahead as investors assess the strength of U.S. consumers. Additionally, investors will monitor incoming inflation figures and implications for Fed policy.
|
Monthly Spotlight
Are Tariffs Inflationary?
Leading up to the presidential election in November, investors began contemplating the impact of many of Donald Trump's policies. One that has gotten a lot of attention since the election is his proposal for tariffs. Trump has proposed a few flavors of tariffs, with the most recent being an 'additional' 10% tax on many imports from China and 25% on all products from Mexico and Canada. Trump had previously proposed a 60% tariff for China, so it is possible that the 10% is in addition to that figure. Nevertheless, we remain cognizant that these tariffs are likely a negotiating tactic to bring country leaders to the table. However, we believe Trump will authorize these tariffs if negotiations don’t go his way regarding Mexico and Canada, which means discussions on immigration and drug trafficking.
While there are still many uncertainties, we want to analyze the impact of tariffs on U.S. inflation. To do this, we looked at Trump’s most severe proposal of a 60% tariff on China. The positive side of this analysis would mention that imports from China are overwhelmingly goods, and goods inflation is negative in the U.S. right now. Our evaluation indicates that a 60% tax on goods from China would raise aggregate prices by about 0.5-1.0%. This is because goods account for only 1/3 of PCE inflation, and Chinese imports account for only 13% of all goods sold in the U.S. Using these assumptions, one could conclude a 60% tariff on China, taken alone, would not result in meaningfully higher inflation. Additionally, an important distinction is that a single tariff is not inflationary but rather a one-time price level increase, which many investors (and potentially the Fed) would likely look through when analyzing inflation. Separately, if prices for certain products increase significantly, there could be changes in consumer behavior as Americans purchase other products ('substitution effect').
The challenge with tariffs is that global trade is a complex ecosystem with many interconnected pieces. Consequentially, the downside risks of a 60% tariff on Chinese goods are the second or third order effects and their impact on inflation and growth. We would expect China to retaliate to a tariff in some capacity, which has the potential to lead to a larger trade war. There is also a potential that tariffs cause supply chain disruptions as companies shift their operations to avoid additional costs (Trump has mentioned goods produced in the U.S. will not be subject to tariffs). Another difficult theme to predict is the impact on global relations and a possible domino effect from other countries.
| While some of these impacts may take time to flow through the global economy, investors have recently increased their short-term expectations for U.S. inflation. We believe inflation expectations have moved too high based on our current anticipation of Trump’s policies and understanding of the motivation for these public tariff proposals. Additionally, each country’s tariff needs to be analyzed for its impact on specific products or energy consumption. As a result, we will be watching future developments closely for potential impacts on the U.S. macroeconomic landscape and asset prices. |

Source: Fort Washington, Bloomberg, and Macrobond. |
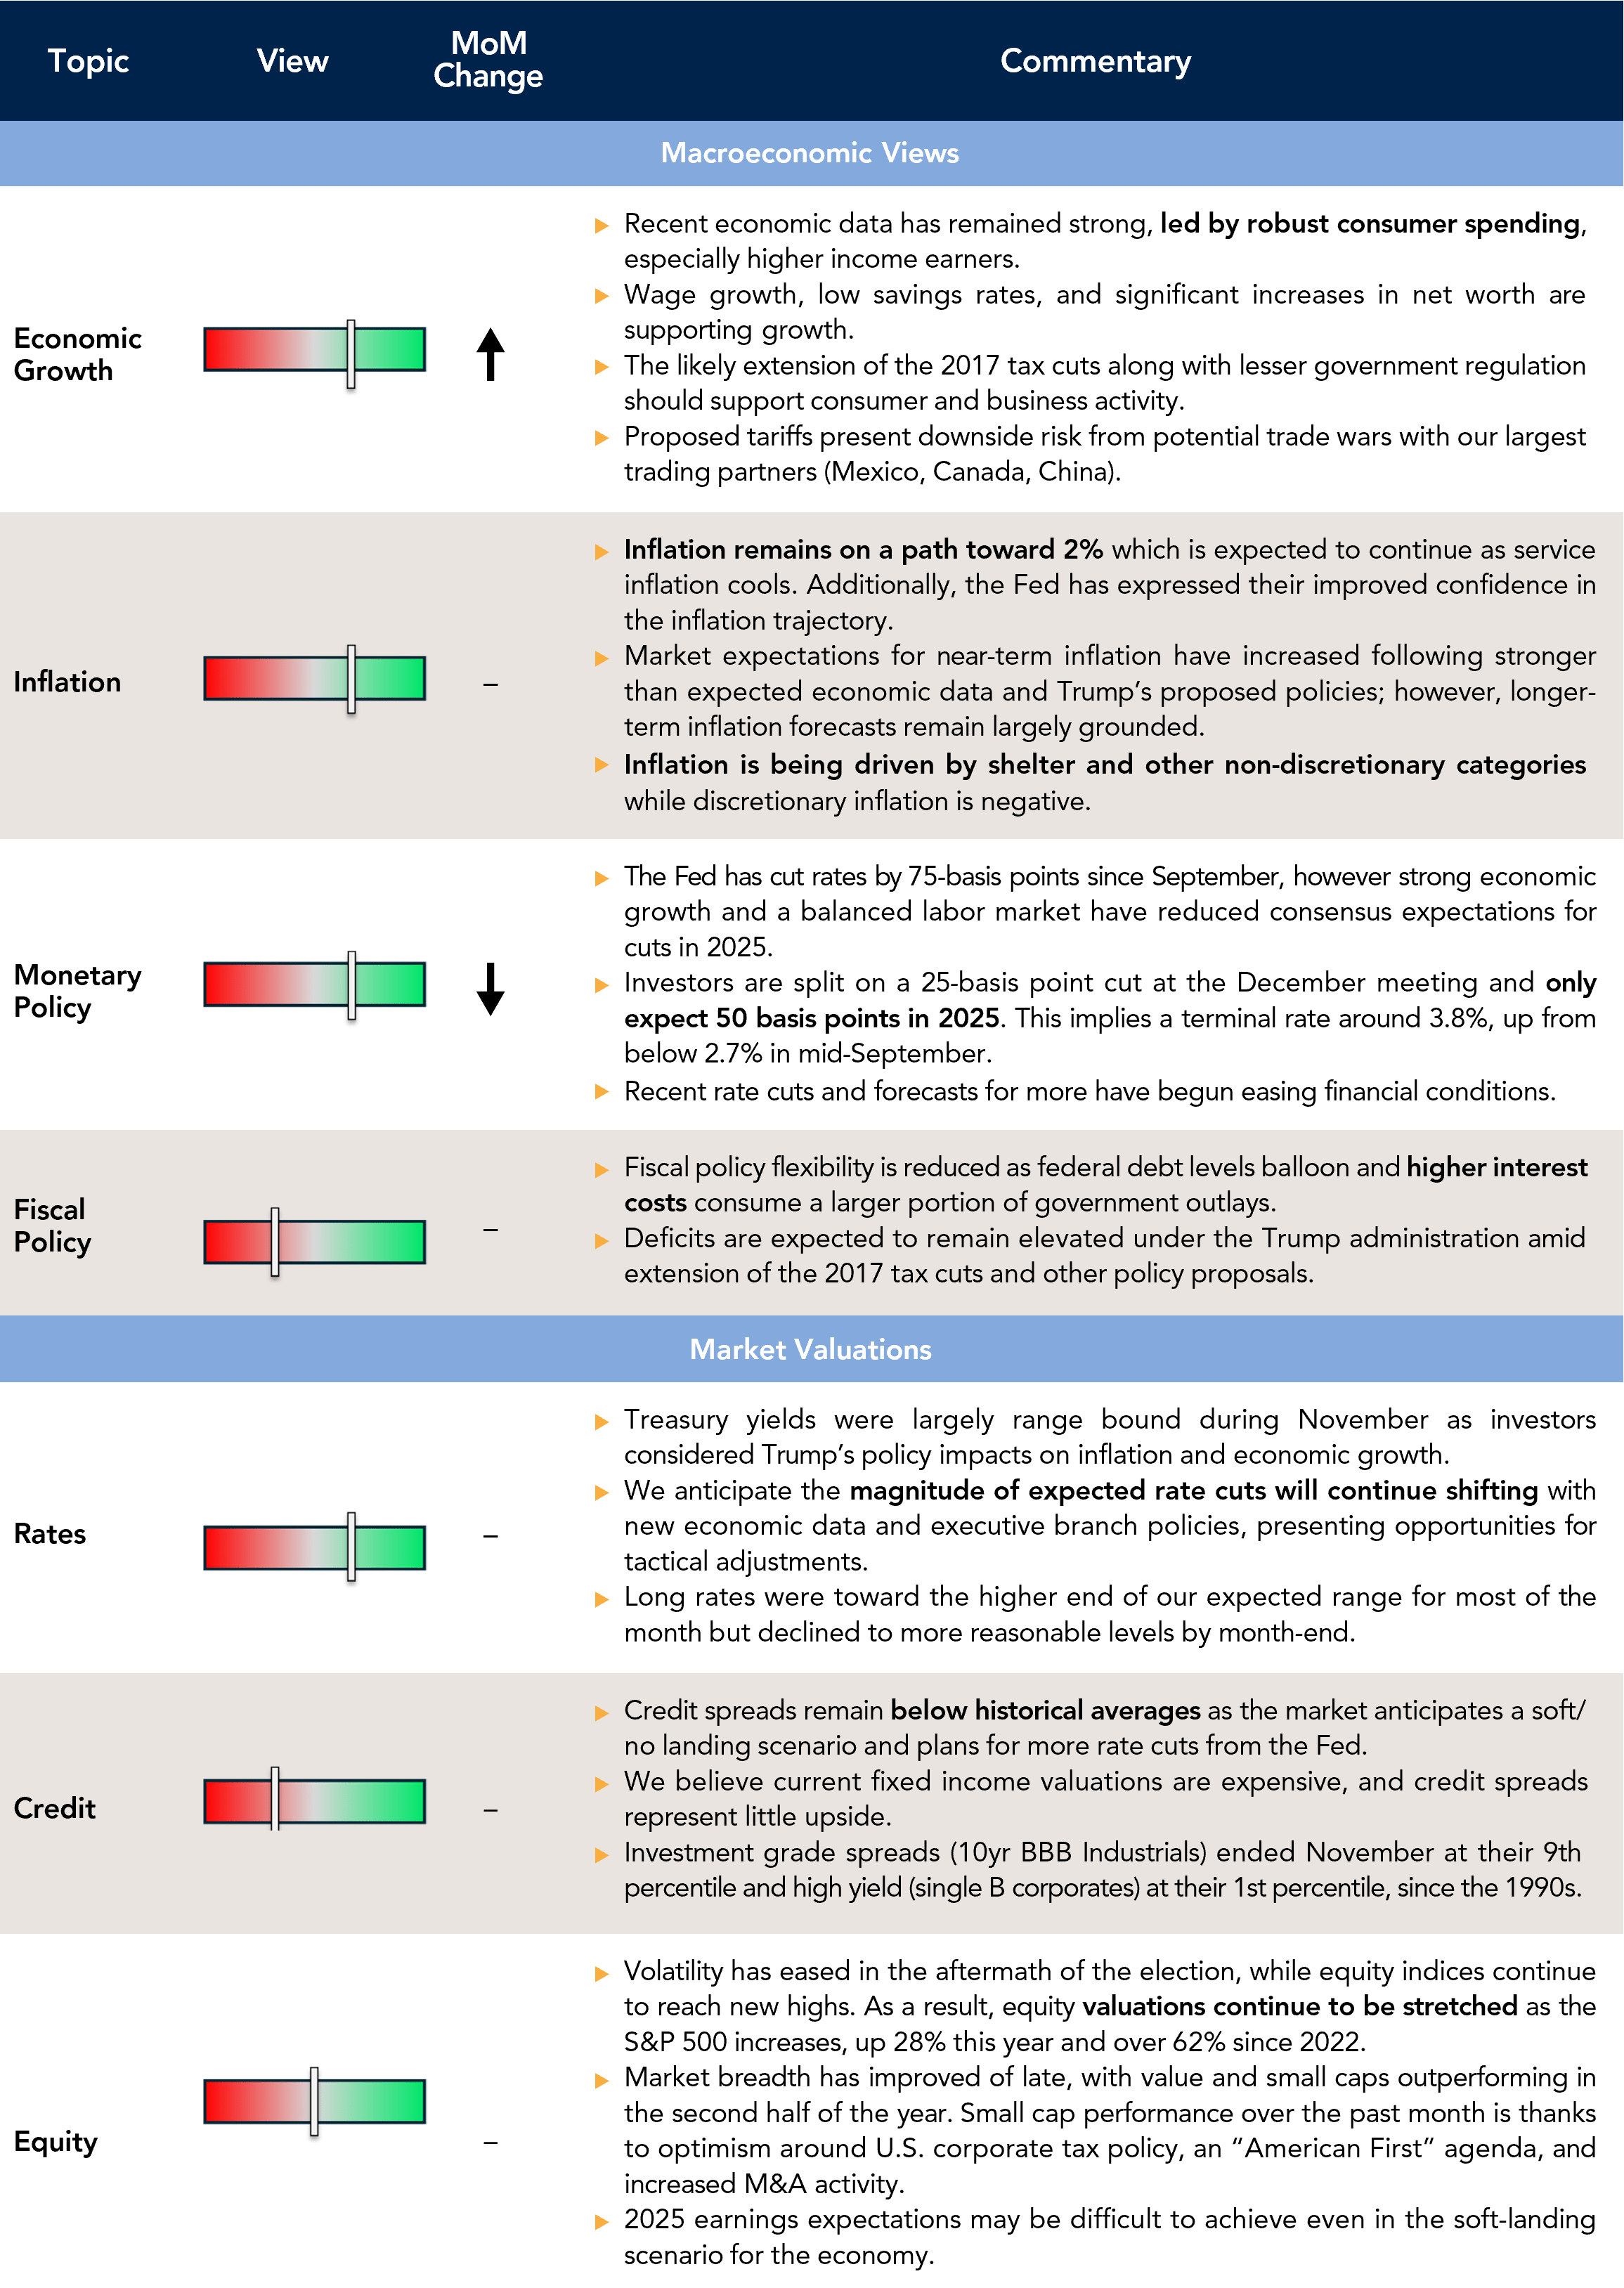
Current Outlook

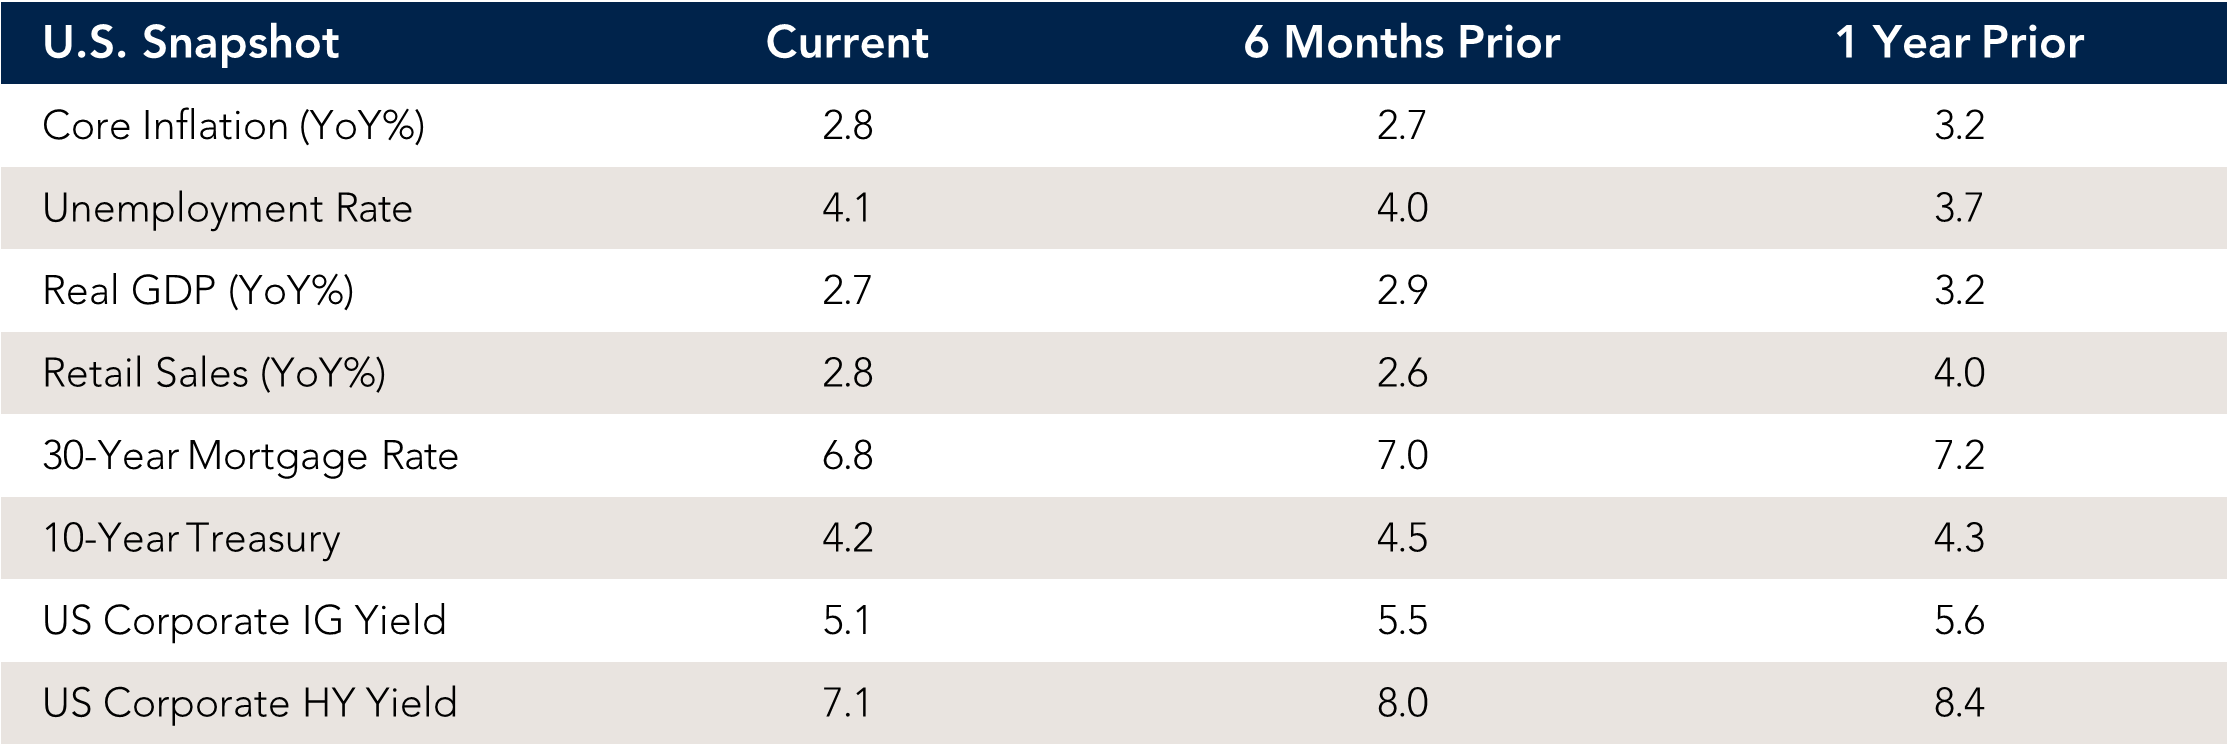
Market Data & Performance
As of 11/30/2024


Source: Fort Washington and Bloomberg. *Returns longer than 1 year are annualized. Past performance is not indicative of future results.
Download Monthly Market Pulse – December 2024
Download Monthly Market Pulse – December 2024


